-
elk+logback实现SpringBoot日志分布式收集
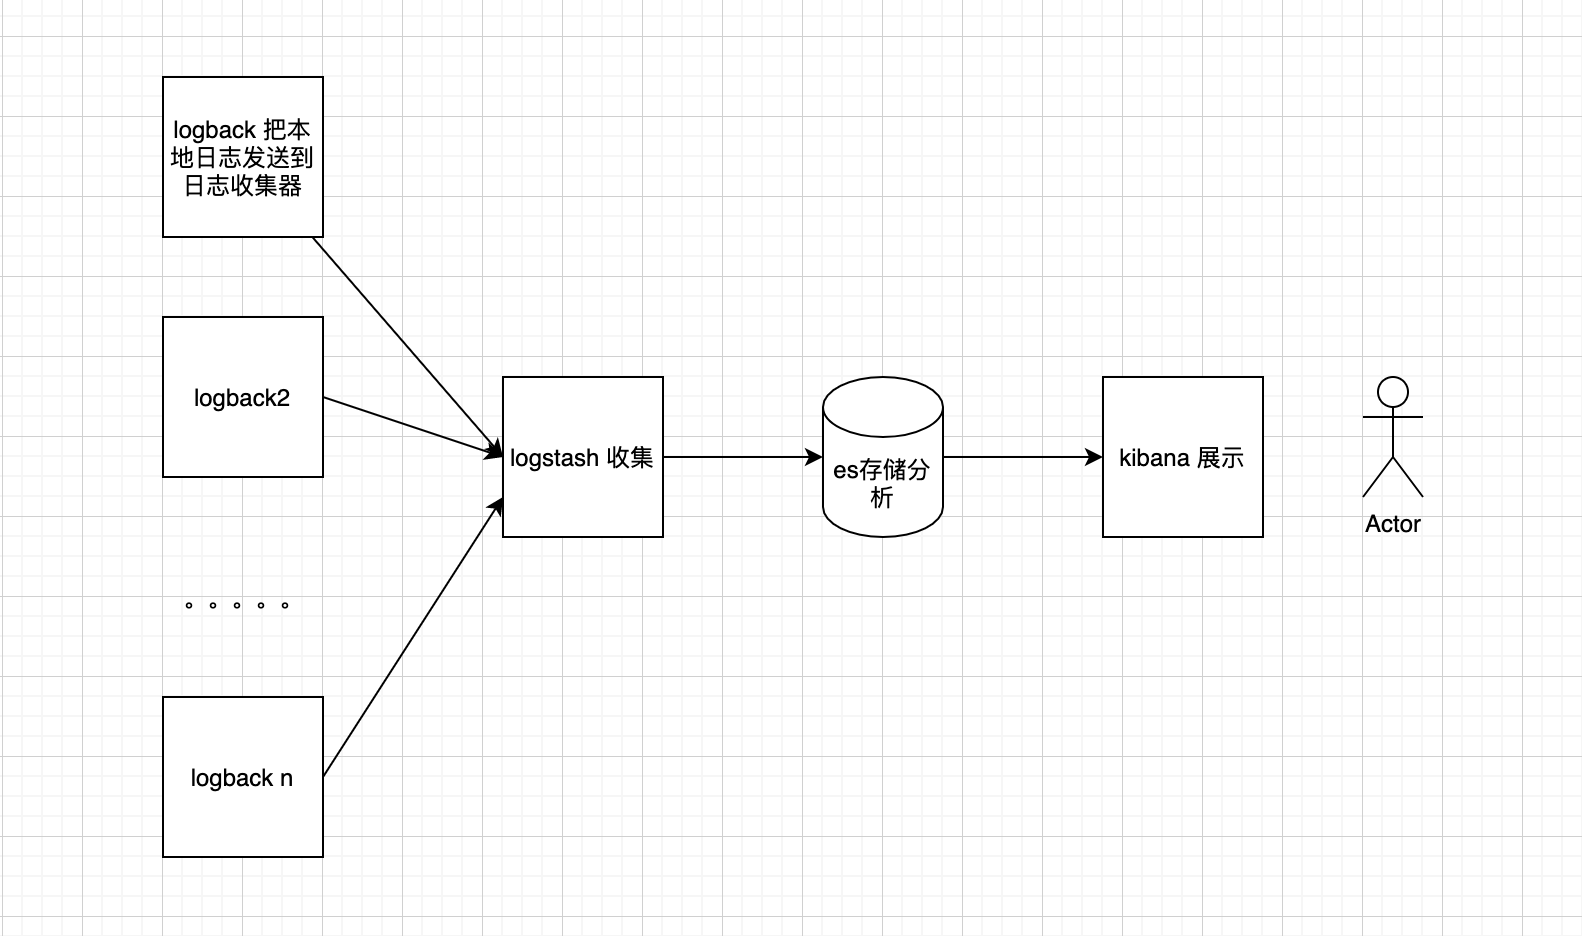
日志收集整体架构
Elk安装
主要参考 ELK(Elasticsearch、Logstash、Kibana)安装_慕菲烟云的博客-CSDN博客
cd /usr/local wget https://artifacts.elastic.co/downloads/elasticsearch/elasticsearch-6.4.3.tar.gz vim /usr/local/elasticsearch-6.4.3/config/elasticsearch.yml #配置es的集群名称,默认是elasticsearch,es会自动发现在同一网段下的es,如果在同一网段下有多个集群,就可以用这个属性来区分不同的集群。 cluster.name: my-es #节点名称 node.name: node-1 #设置索引数据的存储路径 path.data: /usr/local/elasticsearch-6.4.3/data #设置日志的存储路径 path.logs: /usr/local/elasticsearch-6.4.3/logs #设置当前的ip地址,通过指定相同网段的其他节点会加入该集群中 network.host: 0.0.0.0 #设置对外服务的http端口 http.port: 9200 #设置集群中master节点的初始列表,可以通过这些节点来自动发现新加入集群的节点 discovery.zen.ping.unicast.hosts: ["127.0.0.1","10.10.10.34:9200"] ## 1.不允许使用 root 启动 es useradd esuser passwd esuser chown -R esuser:esuser /usr/local/elasticsearch-6.4.3 cd /usr/local/elasticsearch bin/elasticsearch ## 2.无法创建本地文件问题,用户最大可创建文件数太小 sudo vi /etc/security/limits.conf * soft nofile 65536 * hard nofile 131072 ## 3.最大虚拟内存太小 sudo vi /etc/sysctl.conf vm.max_map_count=655360 sudo sysctl -p ## 启动服务(需要后台启动 加上 -d) bin/elasticsearch ## 访问测试 http://xxxx:9200/ ## elasticsearch-head git clone https://github.com/mobz/elasticsearch-head.git cd elasticsearch-head/ # 这一步可能存在有个插件无法安装,手动下载,按照报错提示手动安装 npm install ## 配置elasticsearch,允许head插件远程访问 cd /usr/local/elasticsearch-6.4.3/config vi elasticsearch.yml #在配置文件末尾添加如下内容,重新启动elasticsearch服务 http.cors.enabled: true http.cors.allow-origin: "*" # 启动elasticsearch-head服务 cd /usr/local/elasticsearch-head/ npm run start #如果后台启动使用 nohup npm run start & ## 访问 http://xxxx:9100/ ## 安装 Logstash wget https://artifacts.elastic.co/downloads/logstash/logstash-6.4.3.tar.gz tar -zxvf logstash-6.4.3.tar.gz cd /usr/local/logstash-6.4.3/config/ mkdir conf.d vi conf.d/logstash-es.conf #输入以下内容 input { tcp { port => 10514 codec=>json_lines host => "0.0.0.0" } } output { stdout{ codec => rubydebug } elasticsearch { action => "index" hosts => ["localhost:9200"] index => "renren" } } ## 10514:接受日志端口 ## hosts => ["localhost:9200"] :es的ip和端口 ## "%{[appname]}" :取值日志中appname值为索引 ## 检测配置文件是否有错 /usr/local/logstash-6.4.3/bin/logstash --path.settings /usr/local/logstash-6.4.3/config/ -f /usr/local/logstash-6.4.3/config/conf.d/logstash-es.conf --config.test_and_exit /usr/local/logstash-6.4.3/bin/logstash --path.settings /usr/local/logstash-6.4.3/config/ -f /usr/local/logstash-6.4.3/config/conf.d/logstash-es.conf # Kibana wget https://artifacts.elastic.co/downloads/kibana/kibana-6.4.3-linux-x86_64.tar.gz tar -zxvf kibana-6.4.3-linux-x86_64.tar.gz cd /usr/local/kibana-6.4.3-linux-x86_64 vi config/kibana.yml #修改一下内容 server.port: 5601 ##服务端口 server.host: "0.0.0.0" ##服务器ip 本机 elasticsearch.url: "http://localhost:9200" ##elasticsearch服务地址 与elasticsearch对应 # 启动 /usr/local/kibana-6.4.3-linux-x86_64/bin/kibana # 访问 5601- 1
- 2
- 3
- 4
- 5
- 6
- 7
- 8
- 9
- 10
- 11
- 12
- 13
- 14
- 15
- 16
- 17
- 18
- 19
- 20
- 21
- 22
- 23
- 24
- 25
- 26
- 27
- 28
- 29
- 30
- 31
- 32
- 33
- 34
- 35
- 36
- 37
- 38
- 39
- 40
- 41
- 42
- 43
- 44
- 45
- 46
- 47
- 48
- 49
- 50
- 51
- 52
- 53
- 54
- 55
- 56
- 57
- 58
- 59
- 60
- 61
- 62
- 63
- 64
- 65
- 66
- 67
- 68
- 69
- 70
- 71
- 72
- 73
- 74
- 75
- 76
- 77
- 78
- 79
- 80
- 81
- 82
- 83
- 84
- 85
- 86
- 87
- 88
- 89
- 90
- 91
- 92
- 93
- 94
- 95
- 96
- 97
- 98
- 99
- 100
- 101
- 102
- 103
- 104
- 105
- 106
- 107
- 108
- 109
- 110
- 111
- 112
- 113
- 114
- 115
- 116
- 117
SpringBoot 项目 logback 配置
依赖
<dependency> <groupId>net.logstash.logbackgroupId> <artifactId>logstash-logback-encoderartifactId> <version>7.2version> dependency>- 1
- 2
- 3
- 4
- 5
logback-spring.xml
<appender name="stash" class="net.logstash.logback.appender.LogstashTcpSocketAppender"> <destination>192.168.x.x:10514destination> <encoder class="net.logstash.logback.encoder.LogstashEncoder"/> appender> <root level="info"> <appender-ref ref="stash"/> root>- 1
- 2
- 3
- 4
- 5
- 6
- 7
- 8
测试
启动SpringBoot项目后,会输出到 logstash,观察 控制台

kibana dev tool

discovery
首先需要手动配置 index partterns

然后看 discovery

展望
对这块的原理还是使用细节还需要后续打磨
- logback 合理化配置规则
- Logstash 作为传输中间件的其他使用(比如 收集 mysql)以及具体配置
- 加上 kafka 作为缓存
- es概念以及集群
- Kibana 常见展示策略
-
相关阅读:
数学建模-2022年亚太赛C题(含思路过程和代码)
Spring Boot 中 Controller 接口参数注解全攻略与实战案例详解
技术冲浪: 拥抱 WordPress 官网时代
java 8 stream API
android8.1中用libtinyalsa编写sound-hal驱动
60V降压恒流芯片 高调光比LED驱动器 SL6015B替代PT4115 电路简单
服务器内存一般多大?(服务器内存够用吗)
基于EIoT能源物联网的工厂智能照明系统应用改造-Susie 周
Linux :mysql数据库自动备份
机器学习总结(二)
- 原文地址:https://blog.csdn.net/qq_39007838/article/details/127772935
