-
python 绘制3D图
python 绘制3D图
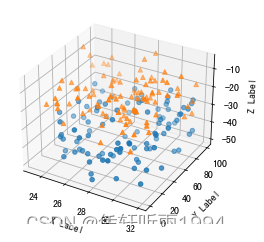
1.散点图
代码
# This import registers the 3D projection, but is otherwise unused. from mpl_toolkits.mplot3d import Axes3D # noqa: F401 unused import import matplotlib.pyplot as plt import numpy as np # Fixing random state for reproducibility np.random.seed(19680801) def randrange(n, vmin, vmax): ''' Helper function to make an array of random numbers having shape (n, ) with each number distributed Uniform(vmin, vmax). ''' return (vmax - vmin)*np.random.rand(n) + vmin fig = plt.figure() ax = fig.add_subplot(111, projection='3d') n = 100 # For each set of style and range settings, plot n random points in the box # defined by x in [23, 32], y in [0, 100], z in [zlow, zhigh]. for m, zlow, zhigh in [('o', -50, -25), ('^', -30, -5)]: xs = randrange(n, 23, 32) ys = randrange(n, 0, 100) zs = randrange(n, zlow, zhigh) ax.scatter(xs, ys, zs, marker=m) ax.set_xlabel('X Label') ax.set_ylabel('Y Label') ax.set_zlabel('Z Label') plt.show()- 1
- 2
- 3
- 4
- 5
- 6
- 7
- 8
- 9
- 10
- 11
- 12
- 13
- 14
- 15
- 16
- 17
- 18
- 19
- 20
- 21
- 22
- 23
- 24
- 25
- 26
- 27
- 28
- 29
- 30
- 31
- 32
- 33
- 34
- 35
输出:
输入的数据格式
这个输入的三个维度要求是三列长度一致的数据,可以理解为3个length相等的list。
用上面的scatter或者下面这段直接plot也可以。fig = plt.figure() ax = fig.gca(projection='3d') ax.plot(h, z, t, '.', alpha=0.5) plt.show()- 1
- 2
- 3
- 4
输出:

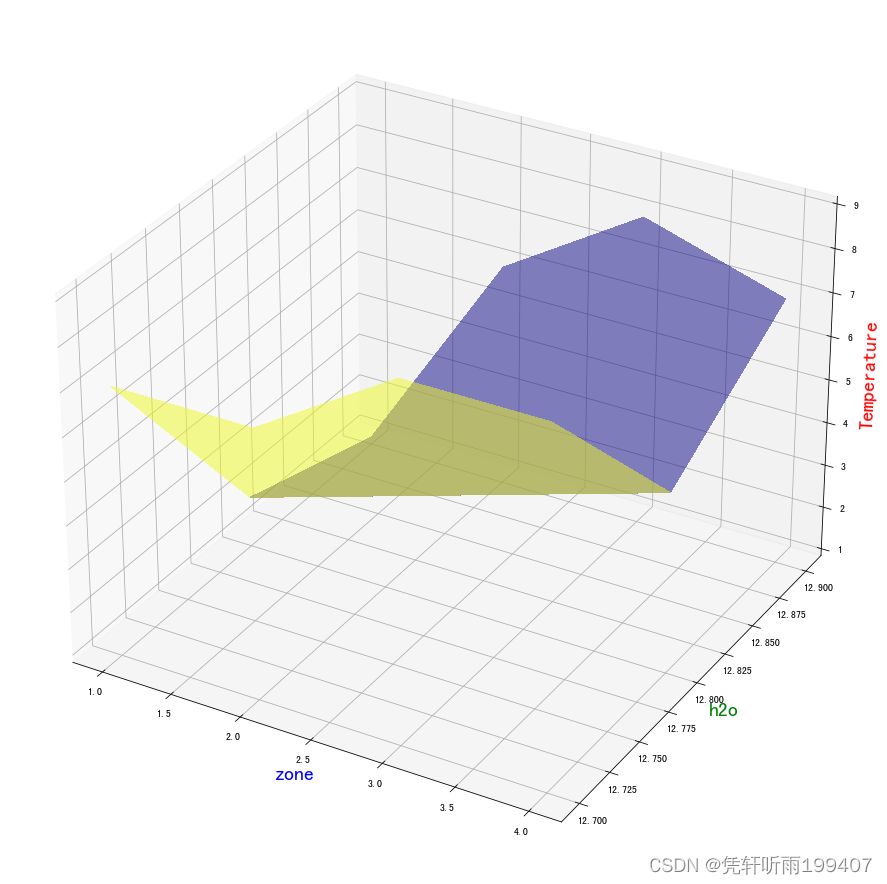
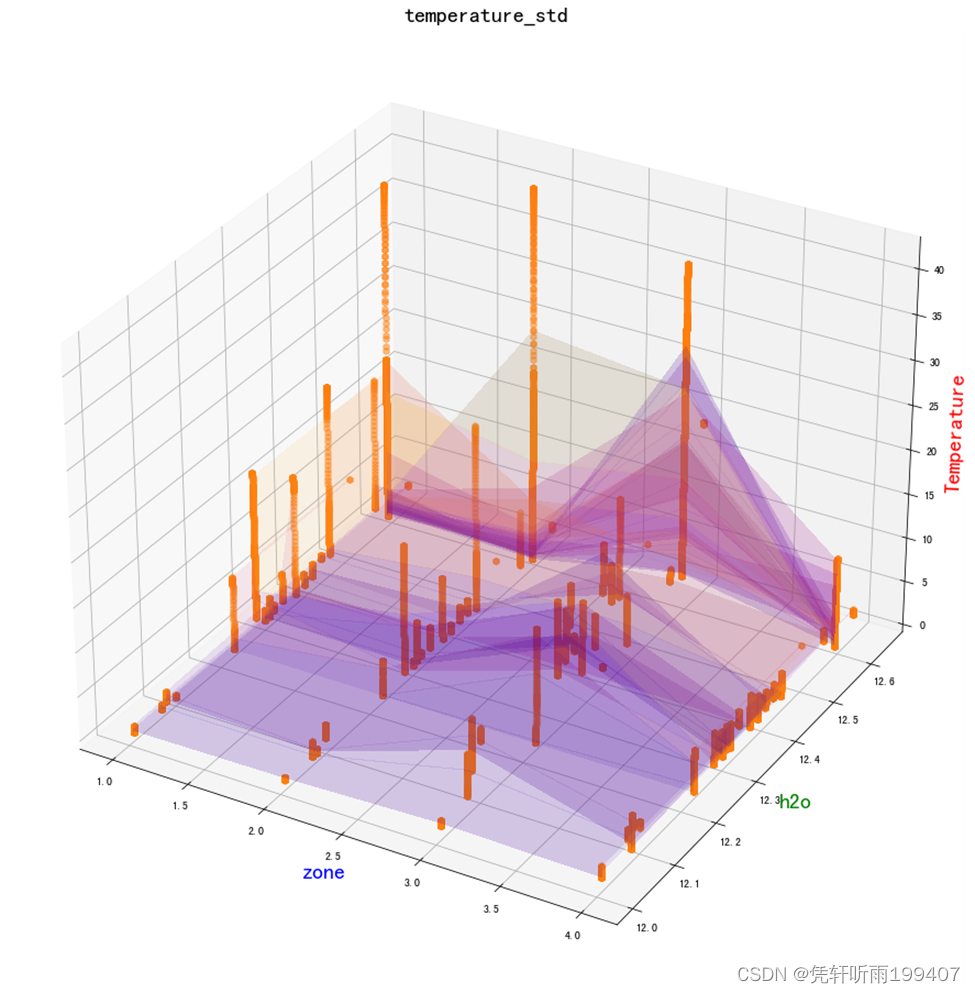
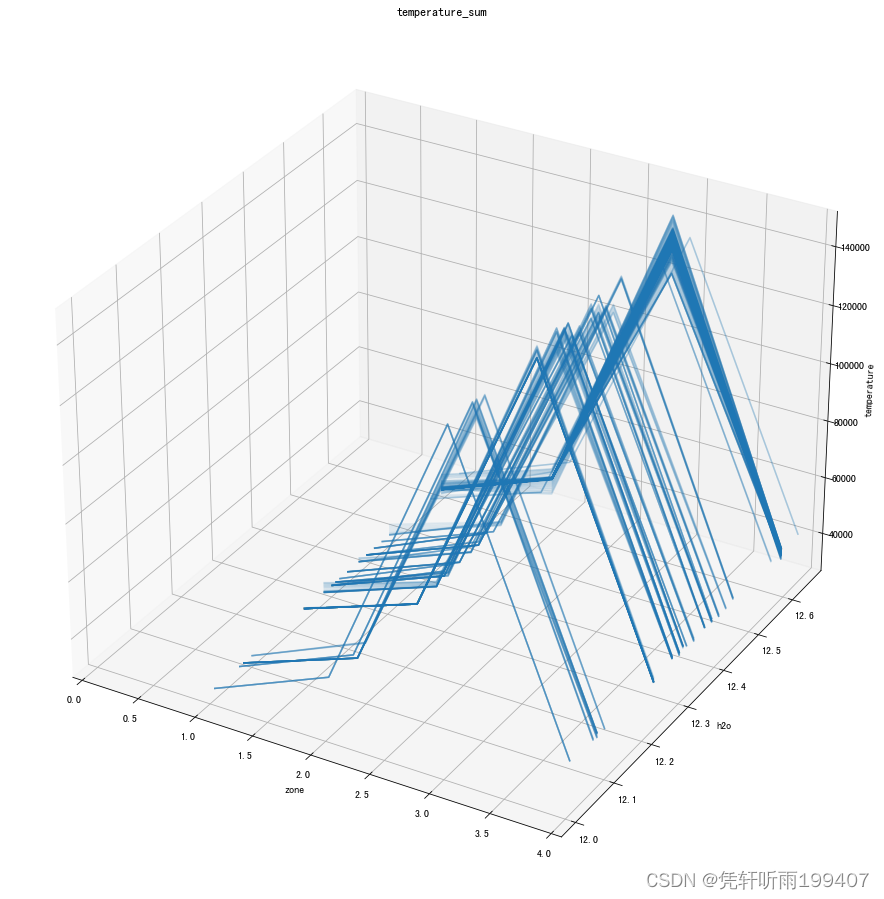
2.三维表面 surface
代码
x = [12.7, 12.8, 12.9] y = [1, 2, 3, 4] temp = pd.DataFrame([[7,7,9,9],[2,3,4,5],[1,6,8,7]]).T X,Y = np.meshgrid(x,y) # 形成网格化的数据 temp = np.array(temp) fig = plt.figure(figsize=(16, 16)) ax = fig.gca(projection='3d') ax.plot_surface(Y,X,temp,rcount=1, cmap=cm.plasma, linewidth=1, antialiased=False,alpha=0.5) #cm.plasma ax.set_xlabel('zone', color='b', fontsize=20) ax.set_ylabel('h2o', color='g', fontsize=20) ax.set_zlabel('Temperature', color='r', fontsize=20)- 1
- 2
- 3
- 4
- 5
- 6
- 7
- 8
- 9
- 10
- 11
output:
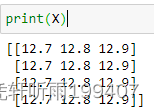
输入的数据格式
这里x和y原本都是一维list,通过np.meshgrid可以将其形成4X3的二维数据,如下图所示:
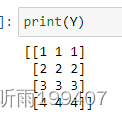
而第三维,得是4X3的2维的数据,才能进行画图scatter + surface图形展示
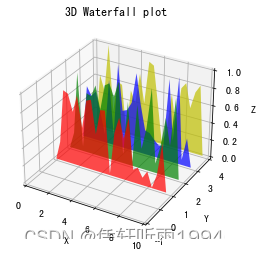
3. 三维瀑布图waterfall
代码
from matplotlib.collections import PolyCollection import matplotlib.pyplot as plt from matplotlib import colors as mcolors import numpy as np axes=plt.axes(projection="3d") def colors(arg): return mcolors.to_rgba(arg, alpha=0.6) verts = [] z1 = [1, 2, 3, 4] x1 = np.arange(0, 10, 0.4) for z in z1: y1 = np.random.rand(len(x1)) y1[0], y1[-1] = 0, 0 verts.append(list(zip(x1, y1))) # print(verts) poly = PolyCollection(verts, facecolors=[colors('r'), colors('g'), colors('b'), colors('y')]) poly.set_alpha(0.7) axes.add_collection3d(poly, zs=z1, zdir='y') axes.set_xlabel('X') axes.set_xlim3d(0, 10) axes.set_ylabel('Y') axes.set_ylim3d(-1, 4) axes.set_zlabel('Z') axes.set_zlim3d(0, 1) axes.set_title("3D Waterfall plot") plt.show()- 1
- 2
- 3
- 4
- 5
- 6
- 7
- 8
- 9
- 10
- 11
- 12
- 13
- 14
- 15
- 16
- 17
- 18
- 19
- 20
- 21
- 22
- 23
- 24
- 25
- 26
- 27
- 28
- 29
- 30
- 31
- 32
- 33
输出:
输入的数据格式
这个的输入我还没有完全搞懂,导致我自己暂时不能复现到其他数据,等以后懂了再回来补充。
4. 3d wireframe
code
from mpl_toolkits.mplot3d import axes3d import matplotlib.pyplot as plt fig, (ax1, ax2) = plt.subplots( 2, 1, figsize=(8, 12), subplot_kw={'projection': '3d'}) # Get the test data X, Y, Z = axes3d.get_test_data(0.05) # Give the first plot only wireframes of the type y = c ax1.plot_wireframe(X, Y, Z, rstride=10, cstride=0) ax1.set_title("Column (x) stride set to 0") # Give the second plot only wireframes of the type x = c ax2.plot_wireframe(X, Y, Z, rstride=0, cstride=10) ax2.set_title("Row (y) stride set to 0") plt.tight_layout() plt.show()- 1
- 2
- 3
- 4
- 5
- 6
- 7
- 8
- 9
- 10
- 11
- 12
- 13
- 14
- 15
- 16
- 17
- 18
- 19
- 20
output:

输入的数据格式
与plot_surface的输入格式一样,X,Y原本为一维list,通过np.meshgrid形成网格化数据。Z为二维数据。其中注意调节rstride、cstride这两个值实现行列间隔的调整。
自己试了下:
reference:
https://matplotlib.org/stable/gallery/mplot3d/hist3d.html
先自我介绍一下,小编13年上师交大毕业,曾经在小公司待过,去过华为OPPO等大厂,18年进入阿里,直到现在。深知大多数初中级java工程师,想要升技能,往往是需要自己摸索成长或是报班学习,但对于培训机构动则近万元的学费,着实压力不小。自己不成体系的自学效率很低又漫长,而且容易碰到天花板技术停止不前。因此我收集了一份《java开发全套学习资料》送给大家,初衷也很简单,就是希望帮助到想自学又不知道该从何学起的朋友,同时减轻大家的负担。添加下方名片,即可获取全套学习资料哦
-
相关阅读:
电动吸吮式过滤器 自清洗过滤器
yolov8-pose的数据集标注
回溯:组合、子集、排列 算法总结
二叉树与树、森林之间的转换
FFmpeg 视频添加水印
【etcd】go etcd实战一:etcd基本使用
WGAN(1)——为什么不能直接拟合原始分布Pr
day13【代码随想录】环形链表II、环形链表、快乐数、各位相加、丑数、丑数||
算法通过村第十四关-堆|白银笔记|经典问题
[附源码]计算机毕业设计springboot小太阳幼儿园学生管理系统
- 原文地址:https://blog.csdn.net/m0_67402588/article/details/126113902
