-
Element Plus Table 表格 单元格内容过长处理
问题描述
用Element Plus框架进行网站的搭建,用到了组件Table,进行列表数据的展示,但由于数据内容过长导致列换行了,自己感觉不美观,想处理下,由于也是才用这个框架对属性没有认真的看,导致走了不少弯路,其实框架本身已经给我们提供了处理办法。
弯路解决(不推荐)
自己参考了一个开源的一个插件:https://github.com/kaysonli/v-fit-columns,此插件可实现el-table-column宽度自适应但基于vue2开发的。但Element Plus框架是基于vue3的所以我对这个源码进行了修改以适应vue3。实际上就是自定义命令v-fit-columns来对列进行扩宽处理,具体可以参考下面的代码。
我的项目是基于Vue CLI构建的。
相关代码
// fit-table-columns.js import "../assets/style/fit-table-columns.css" /** * 自定义命令-关于el-table列固定(函数指令`v-fit-columns`) * @param app */ export default (app) => { app.directive('fit-columns', { // 指令具有一组生命周期钩子: // 在绑定元素的 attribute 或事件监听器被应用之前调用 created() { }, // 在绑定元素的父组件挂载之前调用 beforeMount() { }, // 在绑定元素的父组件挂载之后调用 mounted(el, binding) { setTimeout(() => { adjustColumnWidth(el, binding.value); }, 300); }, // 在包含组件的 VNode 更新之前调用 beforeUpdate() { }, // 在包含组件的 VNode 及其子组件的 VNode 更新之后调用 updated(el, binding) { el.classList.add("r-table"); setTimeout(() => { adjustColumnWidth(el, binding.value); }, 300); }, // 在绑定元素的父组件卸载之前调用 beforeUnmount() { }, // 在绑定元素的父组件卸载之后调用 unmounted() { } }) } /** * 调整列宽 * @param table 使用调整列宽命令的table * @param padding 0 */ function adjustColumnWidth(table, padding = 0) { // 获取table的colgroup节点DOM const colgroup = table.querySelector("colgroup"); // 获取colgroup节点所有的列DOM const colDefs = [...colgroup.querySelectorAll("col")]; colDefs.forEach((col) => { const clsName = col.getAttribute("name"); // cells[0]为td的className=`${clsName}`的所有DOM // cells[1]为th的className=`${clsName}`的所有DOM const cells = [ ...table.querySelectorAll(`td.${clsName}`), ...table.querySelectorAll(`th.${clsName}`), ]; // 判断class="leave-alone"是否存在,存在则不需要设置此功能 if (cells[0]?.classList?.contains?.("leave-alone")) { return; } // 通过css选择器获取class="cell"的DOM的宽度 const widthList = cells.map((el) => { return el.querySelector(".cell")?.scrollWidth || 0; }); // 获取一个最大的宽度 const max = Math.max(...widthList); table.querySelectorAll(`col[name=${clsName}]`).forEach((el) => { const oldWidth = el.offsetWidth; // 如果宽度没变就不添加padding if (max > oldWidth) { el.setAttribute("width", max + padding); } }); }); }- 1
- 2
- 3
- 4
- 5
- 6
- 7
- 8
- 9
- 10
- 11
- 12
- 13
- 14
- 15
- 16
- 17
- 18
- 19
- 20
- 21
- 22
- 23
- 24
- 25
- 26
- 27
- 28
- 29
- 30
- 31
- 32
- 33
- 34
- 35
- 36
- 37
- 38
- 39
- 40
- 41
- 42
- 43
- 44
- 45
- 46
- 47
- 48
- 49
- 50
- 51
- 52
- 53
- 54
- 55
- 56
- 57
- 58
- 59
- 60
- 61
- 62
- 63
- 64
- 65
- 66
- 67
- 68
- 69
- 70
- 71
- 72
- 73
- 74
- 75
- 76
- 77
- 78
// fit-table-columns.css /** 表格显示内容的div样式 */ .el-table.r-table .cell { display: inline-block; white-space: nowrap; width: auto; overflow: auto; } /** 表头外的显示数据的div样式 */ .el-table.r-table .el-table__body-wrapper { overflow-x: auto; }- 1
- 2
- 3
- 4
- 5
- 6
- 7
- 8
- 9
- 10
- 11
- 12
// main.js import {createApp} from 'vue' import axios from 'axios' import VueAxios from 'vue-axios' import router from './router' import fitTableColumns from './plugins/fit-table-columns' import App from './App.vue' const app = createApp(App).use(router) app.use(VueAxios, axios) // 注册自定义命令`v-fit-columns` fitTableColumns(app) app.mount('#app')- 1
- 2
- 3
- 4
- 5
- 6
- 7
- 8
- 9
- 10
- 11
- 12
- 13
// tableList.vue <template> <el-table :data="elTable.tableData" stripe border height="250" v-fit-columns > <el-table-column type="selection" width="55" /> <el-table-column type="index" label="序号" width="55"/> <el-table-column v-for="(item,index) in elTable.tableLabels" :key="index" :property="item.property" :label="item.label" :width="item.width" > </el-table-column> </el-table> </template> <script> export default { name: "tableList", data() { return { elTable: { tableLabels: [ {label: '表名称', property: 'tableName'}, {label: '表描述', property: 'tableComment'}, {label: '创建时间', property: 'createTimeFormat'}, {label: '更新时间', property: 'updateTimeFormat'} ], tableData: [{ "createTimeFormat": "2022-04-07 15:27:06", "updateTimeFormat": null, "tableName": "oauth2_authorization_consent", "tableComment": "" }, { "createTimeFormat": "2022-04-07 15:27:31", "updateTimeFormat": "2022-05-25 09:34:08", "tableName": "oauth2_registered_client", "tableComment": "" }] } } } } </script>- 1
- 2
- 3
- 4
- 5
- 6
- 7
- 8
- 9
- 10
- 11
- 12
- 13
- 14
- 15
- 16
- 17
- 18
- 19
- 20
- 21
- 22
- 23
- 24
- 25
- 26
- 27
- 28
- 29
- 30
- 31
- 32
- 33
- 34
- 35
- 36
- 37
- 38
- 39
- 40
- 41
- 42
- 43
- 44
- 45
- 46
- 47
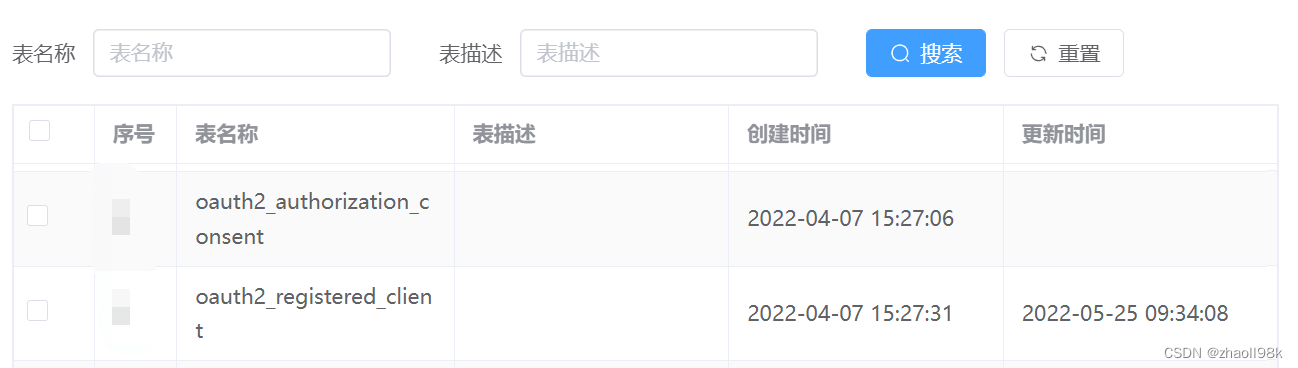
换行前table样式
表名称是换行的
处理后table样式
确实不换行了,列变宽了可以展示全部的数据了,但感觉还是不是很好,因为如果数据很多岂不是行变得很长。还有就是首次加载时,updated方法会执行多次导致table频繁闪动。

官方处理方式(推荐)
有这么个属性:show-overflow-tooltip,文档说明: 若需要单行显示可以使用 show-overflow-tooltip 属性,它接受一个 Boolean, 为 true 时多余的内容会在 hover 时以 tooltip 的形式显示出来。
修改代码
<template> <el-table :data="elTable.tableData" stripe border height="250" > <el-table-column type="selection" width="55" /> <el-table-column type="index" label="序号" width="55"/> <el-table-column v-for="(item,index) in elTable.tableLabels" :key="index" :property="item.property" :label="item.label" :width="item.width" show-overflow-tooltip > </el-table-column> </el-table> </template>- 1
- 2
- 3
- 4
- 5
- 6
- 7
- 8
- 9
- 10
- 11
- 12
- 13
- 14
- 15
- 16
- 17
页面效果
加了show-overflow-tooltip我们再来看一看效果,列没有加宽,而是把溢出的数据用省略号替换并用Tooltip 组件的文字提示。
感觉不错,反正达到我想要的效果。

总结
一定要用认真看官方的文档,以免走弯路。但我这次还好起码学到了vue3关于自定义命令的相关知识。
-
相关阅读:
什么叫做云计算?
浅谈智能安全配电装置应用在银行配电系统中
视频打马赛克并追踪
暑假打工 2 个 月,让我明白了 Keepalived 高可用的三种路由方案
【数独 2】候选数法解数独谜题-挖掘更深的信息-C++实现
汽车电子专业知识篇(四十三)-带你一文通透CAN总线相关知识
LVS+Keepalived NGINX+Keepalived 高可用群集实战部署
WireShark抓包软件的使用 上海商学院 计算机网络 实验作业3
管理类联考——数学——汇总篇——知识点突破——算数——记忆
支持向量机--svm.SVC类
- 原文地址:https://blog.csdn.net/m13012606980/article/details/125429668