-
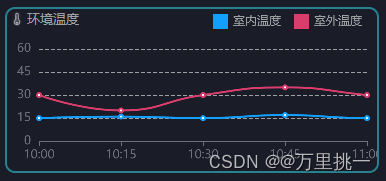
小程序中使用echarts的相关配置以及折线图案例(简单易懂)
第一步:引入echarts文件--此文件需要下载:
下载地址:点击此处进行下载echarts文件
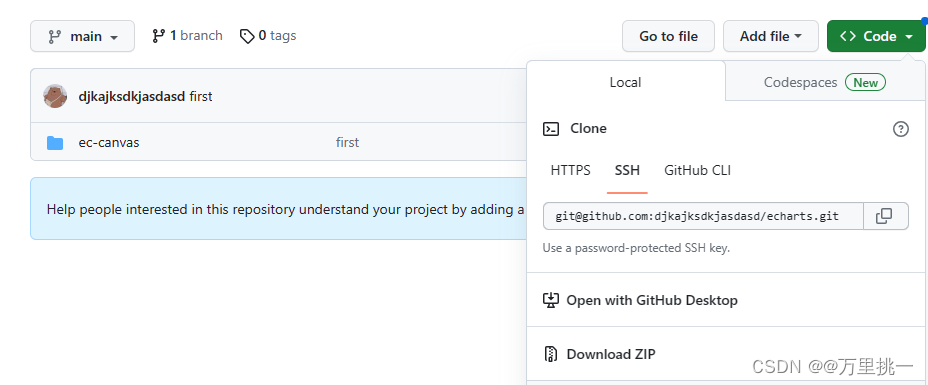
点击Download ZIP下载压缩包,注意:e-canvas是我从完整的文件中剥离出来的有用的,不会影响项目。
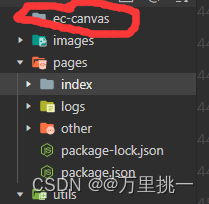
第二步:把整个文件放入到小程序文件里。
第三步:在需要的组件中进行正确引入
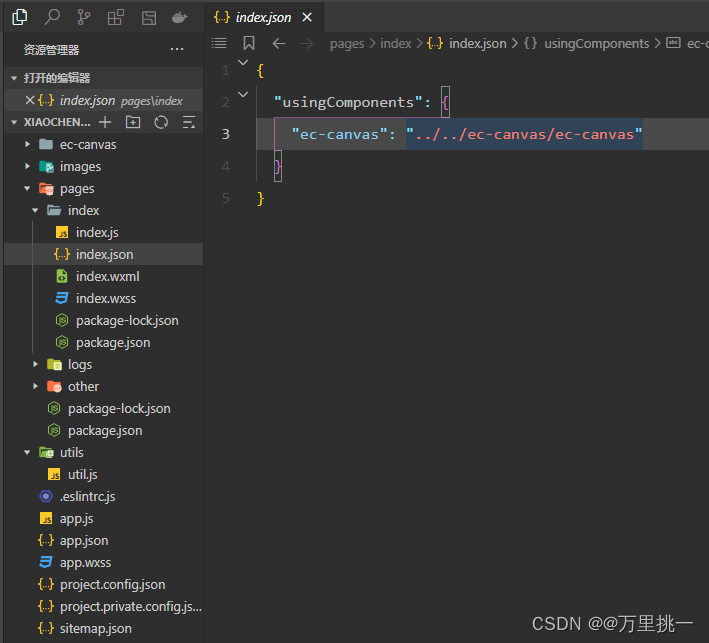
在需要使用echarts的组件的js文件里需要引入
 。
。第四步:案例实现
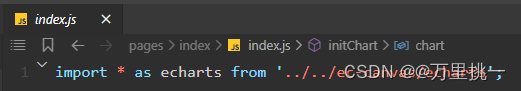
4-1:在index.js中
- import * as echarts from '../../ec-canvas/echarts';
- function initChart(canvas, width, height, dpr) {
- const chart = echarts.init(canvas, null, {
- width: width,
- height: height,
- devicePixelRatio: dpr // new
- });
- canvas.setChart(chart);
- var option = {
- label: {
- normal: {
- show: true
- }
- },
- grid: {
- containLabel: true,
- x: 10, //左
- y: 40, //上
- x2: 10, //右
- y2: 10, //下
- borderWidth: 1,
- },
- legend:{
- icon:'square',
- data:['室内温度','室外温度'],
- right:'10',
- itemWidth: 15,//图标宽
- itemHeight: 15,//图标高
- itemGap: 13,//间距
- textStyle:{
- color:'#9FA0A3',
- fontSize: 12,
- },
- },
- tooltip: {
- trigger: 'axis',
- backgroundColor: 'rgba(255, 255, 255, 0.8)',
- },
- xAxis: {
- type: 'category',
- boundaryGap: false,
- data: ['10:00', '10:15', '10:30', '10:45', '11:00'],
- // show: false
- },
- yAxis: {
- type: 'value',
- min: 0,
- max: 60,
- interval: 15,
- axisLabel: {
- formatter: '{value}'
- },
- splitLine: {
- lineStyle: {
- type: 'dashed',
- color:'#9FA0A3'
- }
- }
- // show: false
- },
- series: [{
- name: '室内温度',
- type: 'line',
- smooth: true,
- data: [15, 16, 15, 17, 15, 16, 17],
- itemStyle:{
- normal:{
- color:'#12A0FF'
- }
- }
- }, {
- name: '室外温度',
- type: 'line',
- smooth: true,
- data: [30, 20, 30, 35, 30, 25, 38],
- itemStyle:{
- normal:{
- color:'#D83D6C'
- }
- }
- }, ]
- };
- chart.setOption(option);
- return chart;
- }
- Page({
- data: {
- ec: {
- onInit: initChart,
- },
- })
4.2:在index.wxml中
- <ec-canvas id="mychart-dom-line" canvas-id="mychart-line" ec="{{ ec }}">ec-canvas>
最后结果
-
相关阅读:
嵌入式分享合集92
GCC
json和axion结合
慢查询SQL如何优化
Bearly:基于人工智能的AI写作文章生成工具
MQ 延迟队列
React技术栈 --》组件生命周期和Vue拓展 ## Day6
Cholesterol-PEG-FITC,Fluorescein-PEG-CLS,胆固醇-聚乙二醇-荧光素供应
ubuntu20.04屏幕亮度无法调节的解决方法->安装 brightness-controller-simple 软件
中级程序员——vue3+js+git面试题
- 原文地址:https://blog.csdn.net/qq_59599812/article/details/133693699
