-
Elastic Stack从入门到实践(一)--Elastic Stack入门(3)--Logstash入门与Elastic Stack实战
Logstash入门
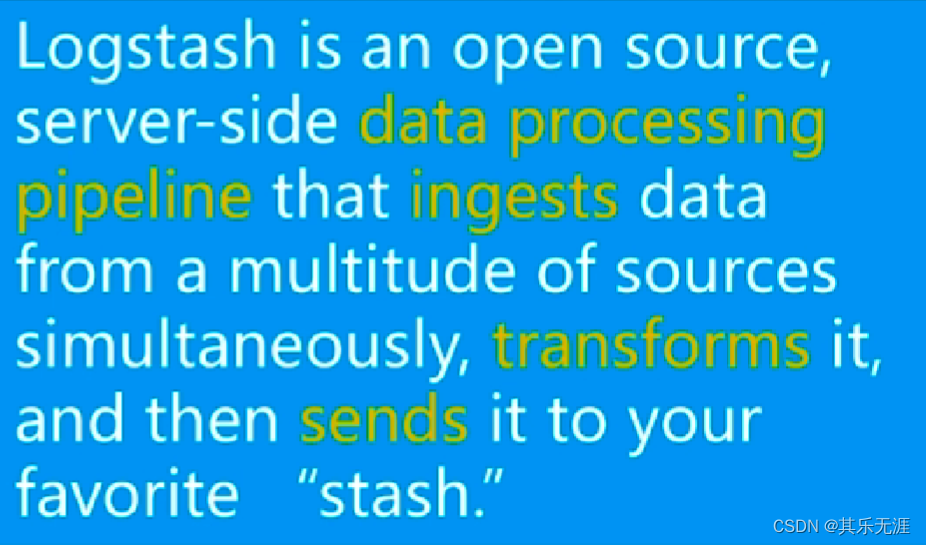
Logstash简介
Data Shipper (不是轻量级的,比beat占用更多资源)
Logstash担任了ETL的角色,它会对数据进行提取Extract、转换Transform、对外的输出Load
处理流程
Input(file、redis、beats、kafka)
Filter(grok、mutate、drop、date)
Output(stdout、elasticsearch、redis、kafka)Logstash配置简介
处理流程 – Input和Output配置


处理流程 – Filter配置
Grok:基于正则表达式提供了丰富可重用的模式(pattern),基于此可以将非结构化数据作结构化处理。


Date:将字符串类型的时间字段转换为时间戳类型,方便后续数据处理。
Mutate:针对结构化后的字段进行增加、修改、删除、替换等字段相关处理。
Logstash 演示
首先下载Logstash并解压
https://www.elastic.co/cn/downloads/past-releases/logstash-6-8-23


创建文件nginx_logstash.confinput { stdin { } } filter { grok { match => { "message" => '%{IPORHOST:remote_ip} - %{DATA:user_name} \[%{HTTPDATE:time}\] "%{WORD:request_action} %{DATA:request} HTTP/%{NUMBER:http_version}" %{NUMBER:response} %{NUMBER:bytes} "%{DATA:referrer}" "%{DATA:agent}"' } } date { match => [ "time", "dd/MMM/YYYY:HH:mm:ss Z" ] locale => en } geoip { source => "remote_ip" target => "geoip" } useragent { source => "agent" target => "user_agent" } } output { stdout { codec => rubydebug } }- 1
- 2
- 3
- 4
- 5
- 6
- 7
- 8
- 9
- 10
- 11
- 12
- 13
- 14
- 15
- 16
- 17
- 18
- 19
- 20
- 21
- 22
- 23
- 24
- 25
- 26
- 27
- 28
- 29
- 30
- 31
- 32
- 33
打开cmd窗口,切换目录到D:\elastic\logstash-6.8.23\bin然后执行命令logstash -f nginx_logstash.conf回车,将nginx.log的两条日志内容,粘贴到启动的窗口回车。
复制内容为93.180.71.3 - - [17/May/2015:08:05:32 +0000] "GET /downloads/product_1 HTTP/1.1" 304 0 "-" "Debian APT-HTTP/1.3 (0.8.16~exp12ubuntu10.21)" 93.180.71.3 - - [17/May/2015:08:05:23 +0000] "GET /downloads/product_1 HTTP/1.1" 304 0 "-" "Debian APT-HTTP/1.3 (0.8.16~exp12ubuntu10.21)"- 1
- 2
执行结果为

实战:分析Elasticsearch 查询语句
实战目标和方案介绍
目标
收集Elasticsearch集群的查询语句
分析查询语句的常用语句、响应时长等方案
应用 Packetbeat + Logstash 完成数据收集工作
使用 Kibana + Elasticsearch 完成数据分析工作

Production Cluster
– Elasticsearch http://127.0.0.1:9200
– Kibana http://127.0.0.1:5601
Monitoring Cluster
– Elasticsearch http://127.0.0.1:8200
– Kibana http://127.0.0.1:8601Production 与 Monitoring 不能是一个集群,否则会进入抓包死循环。
方案之 logstash


方案之packetbeat

实战之数据收集演示
新建一个虚拟机(建议虚拟机内存设置为8G)

把下载好的安装包通过Xftp上传到/usr/local目录下
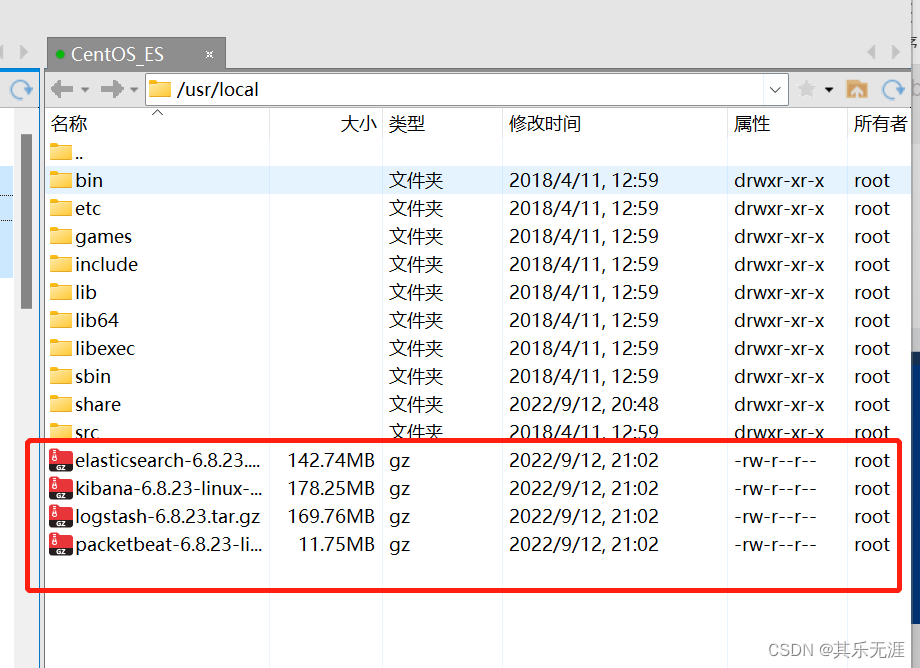
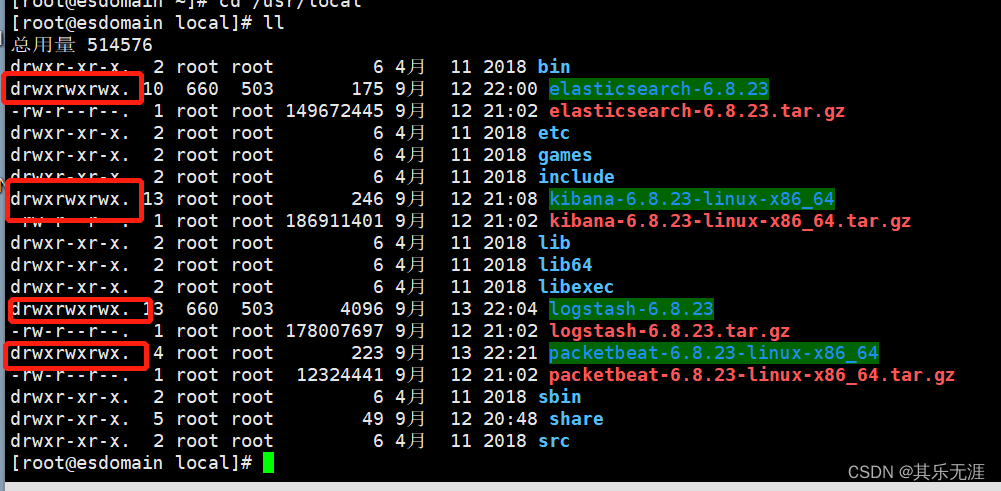
然后用Xshell连接,并解压上传的安装包

为了方便,使用chmod -R 777 ./xxxxx 命令四个应用目录的访问权限。
给系统添加两个用户es1和es2,打开两个Xshell窗口,都用es1用户登录。
一个窗口中切换目录到elasticsearch-6.8.23目录,执行bin/elasticsearch启动es

另个一个窗口切换目录到kibana-6.8.23-linux-x86_64目录,然后执行bin/kibana -e http://127.0.0.1:9200 -p 5601 启动kibana

同样,再打开两个Xshell窗口,都登录es2用户,一个窗口中切换目录到elasticsearch-6.8.23目录,执行bin/elasticsearch -Ecluster.name=sniff_search -Ehttp.port=8200 -Epath.data=sniff_search启动es

另个一个窗口切换目录到kibana-6.8.23-linux-x86_64目录,然后执行bin/kibana -e http://127.0.0.1:8200 -p 8601
启动kibana

再打开一个Xshell窗口,登录es1用户,切换目录到logstash-6.8.23创建一个文件为sniff_search.conf内容为input { beats { port => 5044 } } filter { if "search" in [request]{ grok { match => { "request" => ".*\n\{(?.*)" } } grok { match => { "path" => "\/(?.*)\/_search" } } if [index] { } else { mutate { add_field => { "index" => "All" } } } mutate { update => { "query_body" => "{%{query_body}"}} } # mutate { # remove_field => [ "[http][response][body]" ] # } } output { #stdout{codec=>rubydebug} if "search" in [request]{ elasticsearch { hosts => "127.0.0.1:8200" } } }- 1
- 2
- 3
- 4
- 5
- 6
- 7
- 8
- 9
- 10
- 11
- 12
- 13
- 14
- 15
- 16
- 17
- 18
- 19
- 20
- 21
- 22
- 23
- 24
- 25
- 26
- 27
- 28
- 29
- 30
- 31
- 32
- 33
- 34
- 35
- 36
- 37
- 38
然后执行bin/logstash -f sniff_search.conf 启动logstash

再打开一个Xshell窗口,登录es1用户,切换目录到packetbeat-6.8.23-linux-x86_64创建一个文件为sniff_search.yml内容为
#################### Packetbeat Configuration Example ######################### # This file is an example configuration file highlighting only the most common # options. The packetbeat.full.yml file from the same directory contains all the # supported options with more comments. You can use it as a reference. # # You can find the full configuration reference here: # https://www.elastic.co/guide/en/beats/packetbeat/index.html #============================== Network device ================================ # Select the network interface to sniff the data. On Linux, you can use the # "any" keyword to sniff on all connected interfaces. packetbeat.interfaces.device: any packetbeat.protocols.http: # Configure the ports where to listen for HTTP traffic. You can disable # the HTTP protocol by commenting out the list of ports. ports: [9200] send_request: true include_body_for: ["application/json", "x-www-form-urlencoded"] #================================ Outputs ===================================== # Configure what outputs to use when sending the data collected by the beat. # Multiple outputs may be used. #-------------------------- Elasticsearch output ------------------------------ #output.elasticsearch: # Array of hosts to connect to. # hosts: ["localhost:9200"] # Optional protocol and basic auth credentials. #protocol: "https" #username: "elastic" #password: "changeme" #output.console: # pretty: true output.logstash: hosts: ["127.0.0.1:5044"] #================================ Logging ===================================== # Sets log level. The default log level is info. # Available log levels are: critical, error, warning, info, debug #logging.level: debug # At debug level, you can selectively enable logging only for some components. # To enable all selectors use ["*"]. Examples of other selectors are "beat", # "publish", "service". #logging.selectors: ["*"]- 1
- 2
- 3
- 4
- 5
- 6
- 7
- 8
- 9
- 10
- 11
- 12
- 13
- 14
- 15
- 16
- 17
- 18
- 19
- 20
- 21
- 22
- 23
- 24
- 25
- 26
- 27
- 28
- 29
- 30
- 31
- 32
- 33
- 34
- 35
- 36
- 37
- 38
- 39
- 40
- 41
- 42
- 43
- 44
- 45
- 46
- 47
- 48
- 49
- 50
- 51
- 52
- 53
- 54
- 55
然后执行sudo ./packetbeat -e -c sniff_search.yml -strict.perms=false 启动packetbeat

在虚拟机中打开浏览器,访问http://127.0.0.1:8601访问kibana,试着执行语句GET _cat/indices发现已经有logstash的索引了

可以查询索引中信息

实战之Kibana使用演示
首先把logstash索引加到index patterns里,如图所示


然后就可以用Discover查看数据了

关于Kibana的详细使用,后面再学。 -
相关阅读:
NX二次开发UF_CAM_set_auto_blank 函数介绍
JavaFx学习问题1--图片不显示问题
智能车竞赛新手入门电磁(0基础)(通俗易懂)
Ubuntu20.04 Server 安装NS3 速通版
Mask R-CNN
基于Vue+nodejs+Element-ui的聊天框项目
基于FPGA的VGA协议实现
RabbitMQ 如何保证消息不丢失
【ACL2023】Event Extraction as Question Generation and Answering
浏览器安全-同源策略和CORS
- 原文地址:https://blog.csdn.net/qq_32091929/article/details/126817899
