-
matplotlib中图表常用设置(五)
图表的常用设置
1.添加文本标签
matplotlib.pyplot.text(x,y,s,**kwargs)
通用绘图参数
说明
fontsize
字体大小
ha
水平对齐方式
va
垂直对齐方式
for a,b in zip(x,y):
plt.text(a,b,b,ha="center",va="center",fontsize=12,color="y")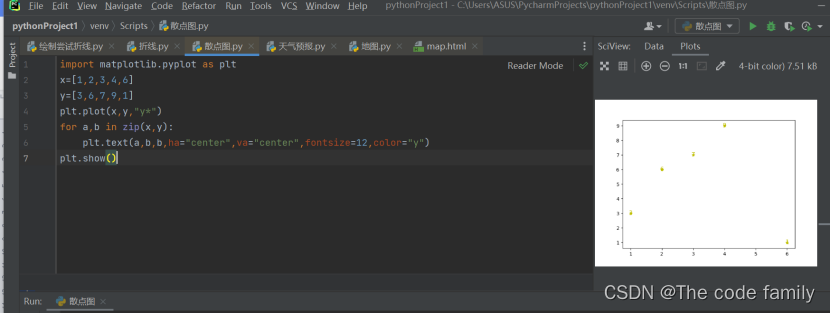
2.设置标题(整个图表的标题)和图例
matplotlib.pyplot.title()
matplotlib.pyplot.lengend()
位置
说明
best
自适应
upper right
右上方
upper left
左上方
lower right
右下方
lower left
左下方
right
右侧
center left
左中间
center right
右中间
upper center
上中间
center
正中央
lower center
下中间
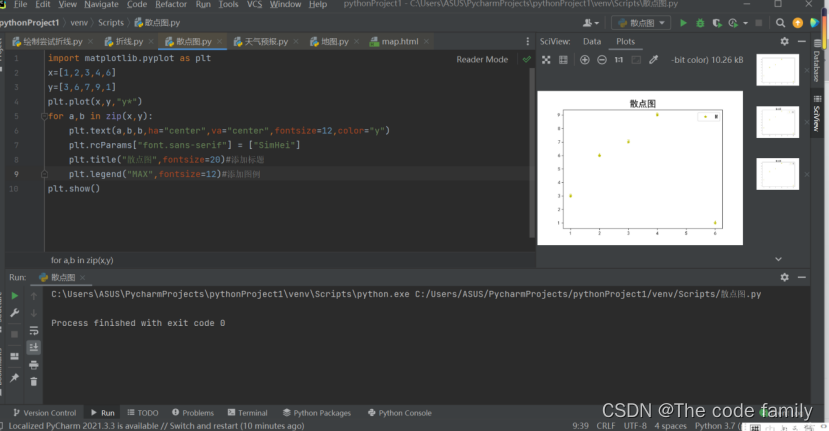
plt.title("散点图",fontsize=20)#添加标题
plt.legend("MAX",fontsize=12)#添加图例注意中文乱码问题,之前文章已经发布过解决办法。
-
相关阅读:
.NET如何快速比较两个byte数组是否相等
关于package-lock.json
Prim 最小生成树 图解
第二十二章 STL初识
uni-app 超详细教程(从菜鸟到大佬)
Spring Boot 系列三:如何自定义一个SpringBoot Srarter
计算机组成原理平时作业二
Zemax操作37--更换玻璃和非球面
03Redis-五大基本数据类型
【深度学习】实验5答案:滴滴出行-交通场景目标检测
- 原文地址:https://blog.csdn.net/m0_62064241/article/details/126692705