-
Python房价分析和可视化<anjuke新房>
Python房价分析和可视化<anjuke新房>
本文是Python数据分析实战的房价分析系列,选择了二线城市贵阳。
数据获取
本文的数据来源于2022年7月anjuke的新房数据。对数据获取不感兴趣可以跳过此部分看分析和可视化。
anjuke的数据获取比较简单,不需要抓包,直接拼接url即可。步骤如下:
1.访问目标页面
进入网站首页,点击选择城市和新房进入<楼盘信息页面>,页面上的筛选条件(位置、价格等)都保持默认,这样可以查出全部楼盘信息。

2.分析url变化
拖动滚动条到翻页的地方,点击几次<上一页>、<下一页>翻页,观察浏览器上方搜索框里url的变化。可以看到每次翻页url只变化一个数字,对应当前的页数。
所以只要不断改变url中的页数,就可以获取所有的数据。
3.获取楼盘总数和每页楼盘数
楼盘总数在页面上可以直接看到,代码中可以直接写死。如果代码以后还会重复使用,最好从HTML文件中提取,这样无论数量怎么变化,代码都能与实际的数量保持一致。
参考代码:import requests import re url = 'https://gy.fang.anjuke.com/loupan/all/' res = requests.get(url, headers=headers) # headers需要自己准备 number = re.findall('共有(.*?)个', res.text)[0]- 1
- 2
- 3
- 4
- 5
- 6
每页的数量直接在页面上数,anjuke新房数据是每页60条。
用总数除每页数量可以得到总页数,总页数就是需要获取的页面数量。
4.循环拼接url获取所有数据
根据总页数,在url中从1开始拼接页数,依次获取所有页面的信息。
参考代码:import time page = int(number)//60 + 1 for p in range(1, page+1): time.sleep(5) new_house_url = 'https://gy.fang.anjuke.com/loupan/all/p{}'.format(p) try: res = requests.get(new_house_url, headers=headers) # headers需要自己准备 print('获取第{}页数据成功'.format(p)) except Exception as e: print('获取第{}页数据失败,报错:{}'.format(p, e))- 1
- 2
- 3
- 4
- 5
- 6
- 7
- 8
- 9
- 10
- 11
5.用XPath提取数据
anjuke的楼盘信息在返回结果的HTML文件中,需要使用XPath语法提取。
参考代码:from lxml import etree result = res.text html = etree.HTML(result) infos = html.xpath("//div[@class='item-mod ']")- 1
- 2
- 3
- 4
- 5
XPath快速入门参考:快速入门XPath语法,轻松解析爬虫时的HTML内容
用XPath获取当前页的所有楼盘信息保存在infos中,infos是一个Element对象的列表,每一个Element对象里的信息是一个楼盘的信息,可以继续用XPath从中提取具体的信息,参考代码:build_name = info.xpath("div[@class='infos']/a[@class='lp-name']/span/text()")[0].strip() address = info.xpath("div[@class='infos']/a[@class='address']/span/text()")[0].strip().replace('\xa0', '') is_sale = info.xpath("div[@class='infos']/a[@class='tags-wrap']/div/i/text()")[0] house_price = info.xpath("a[@class='favor-pos']/p[1]/span/text()") if house_price: house_price = house_price[0] else: house_price = info.xpath("a[@class='favor-pos']/p[1]/text()") price = info.xpath("a[@class='favor-pos']/p[2]/span/text()") house_price = house_price[0] + ',周边均价{}'.format(price[0]) house_type = info.xpath("div[@class='infos']/a[@class='huxing']/span/text()") if house_type: house_type = ','.join(house_type[0:-1]) else: house_type = info.xpath("div[@class='infos']/a[@class='kp-time']/text()")[0] house_area = info.xpath("div[@class='infos']/a[@class='huxing']/span[@class='building-area']/text()") if house_area: house_area = house_area[0] else: house_area = info.xpath("div[@class='infos']/a[@class='kp-time']/text()")[0] house_label = ','.join(info.xpath("div[@class='infos']/a[@class='tags-wrap']/div/span/text()")) build_type = info.xpath("div[@class='infos']/a[@class='tags-wrap']/div/i/text()")[1]- 1
- 2
- 3
- 4
- 5
- 6
- 7
- 8
- 9
- 10
- 11
- 12
- 13
- 14
- 15
- 16
- 17
- 18
- 19
- 20
- 21
- 22
6.将数据保存到excel中
使用pandas将解析的数据转换成DataFrame,然后保存到excel中。最终获取到的数据共498条。

获取数据时可能会遇到验证码,anjuke有两种验证码,一种是拖动滑块,一种是点击指定图形下的字符。遇到验证码时,手动在浏览器页面上点击通过验证再跑代码就行了。
数据清洗
获取到的数据中,有很多是不完整的数据,所以要先清洗数据,再开始分析。
1.删除“售罄”的楼盘# coding=utf-8 import pandas as pd import numpy as np # 数据清洗 df = pd.read_excel('anjuke_new_house.xlsx', index_col=False) print(df.shape) df_new = df.drop(df.loc[df['是否在售']=='售罄'].index) print(df_new.shape)- 1
- 2
- 3
- 4
- 5
- 6
- 7
- 8
- 9
- 10
(498, 9) (187, 9)- 1
- 2
删除“售罄”楼盘后,只剩下了187条数据,这187条数据是“在售”和“待售”楼盘。
2.删除“商住”的户型df_new = df_new.drop(df_new.loc[df_new['户型']=='商住'].index) print(df_new.shape)- 1
- 2
(172, 9)- 1
删除“商住”的户型后,剩下172条数据。
3.填充缺失值print(np.any(df_new.isnull())) df_new.fillna('未知', inplace=True) print(np.any(df_new.isnull()))- 1
- 2
- 3
True False- 1
- 2
4.删除重复值
df_new.drop_duplicates('楼盘', inplace=True) print(df_new.shape)- 1
- 2
(172, 9)- 1
172条数据中没有重复值,本文就基于这172个楼盘的数据进行分析。
在售和待售楼盘数量
from pyecharts.charts import Pie from pyecharts import options as opts # 获取在售和待售的数量 is_sale_counts = df_new['是否在售'].value_counts() pie = Pie(init_opts=opts.InitOpts(width='600px', height='400px', bg_color='white')) pie.add( '', [list(z) for z in zip([gen for gen in is_sale_counts.index], is_sale_counts)], radius=['35%', '60%'], center=['60%', '60%'] ).set_series_opts( label_opts=opts.LabelOpts(formatter="{b}: {c}"), ).set_global_opts( title_opts=opts.TitleOpts(title='在售和待售楼盘数量', pos_left='280', pos_top='50', title_textstyle_opts=opts.TextStyleOpts(color='black', font_size=16)), legend_opts=opts.LegendOpts(pos_left='150', pos_top='100', orient='vertical') ).set_colors(['#4863C4', '#FF9366']).render('is_sale_counts.html')- 1
- 2
- 3
- 4
- 5
- 6
- 7
- 8
- 9
- 10
- 11
- 12
- 13
- 14
- 15
- 16

在售和待售楼盘均价from pyecharts.charts import Bar from pyecharts import options as opts from pyecharts.commons.utils import JsCode df_new['单价'] = df_new['单价'].apply(lambda x: x.replace('售价待定,周边均价', '')) df_new['单价'] = df_new['单价'].values.astype(int) # 计算在售和待售楼盘的均价 is_sale_price = df_new.loc[df_new['是否在售']=='在售', '单价'].mean() stay_sale_price = df_new.loc[df_new['是否在售']=='待售', '单价'].mean() color_function = """function (params) {if (params.value < 10000) return '#4863C4'; else return '#FF9366';}""" bar = Bar(init_opts=opts.InitOpts(width='800px', height='400px', bg_color='white')) bar.add_xaxis(['待售', '在售']).add_yaxis( '', ['%.2f' % stay_sale_price, '%.2f' % is_sale_price], category_gap=80, itemstyle_opts=opts.ItemStyleOpts(color=JsCode(color_function)) ).reversal_axis().set_series_opts( # 设置数字标签的样式 label_opts=opts.LabelOpts(position='right', font_size=24, formatter=JsCode("function (params) {return params.value}")) ).set_global_opts( # 设置标题和横纵坐标的样式 title_opts=opts.TitleOpts(title='在售和待售楼盘均价(元/㎡)', pos_left='250', pos_top='30', title_textstyle_opts=opts.TextStyleOpts(color='black', font_size=16)), xaxis_opts=opts.AxisOpts(is_show=False, max_=13000), yaxis_opts=opts.AxisOpts(axislabel_opts=opts.LabelOpts(font_size=24)) ).render('is_sale_price.html')- 1
- 2
- 3
- 4
- 5
- 6
- 7
- 8
- 9
- 10
- 11
- 12
- 13
- 14
- 15
- 16
- 17
- 18
- 19
- 20
- 21
- 22
- 23
- 24
- 25

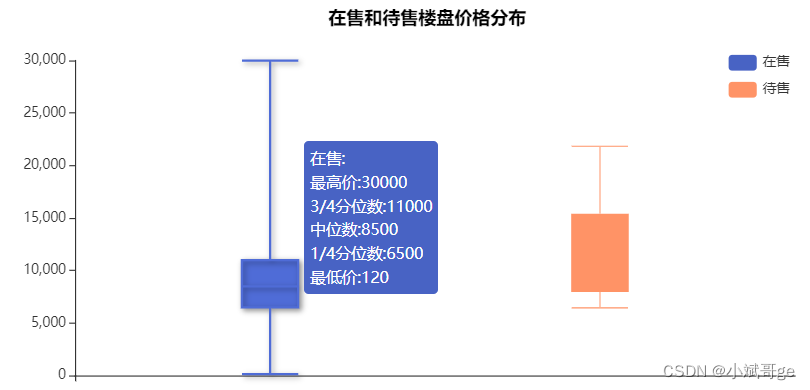
在售和待售楼盘价格分布from pyecharts.charts import Boxplot from pyecharts import options as opts from pyecharts.commons.utils import JsCode df_new['单价'] = df_new['单价'].apply(lambda x: x.replace('售价待定,周边均价', '')) df_new['单价'] = df_new['单价'].values.astype(int) # 获取在售和待售楼盘的单价 is_sale_price = df_new.loc[df_new['是否在售']=='在售', '单价'] stay_sale_price = df_new.loc[df_new['是否在售']=='待售', '单价'] content_function = """function(param) {return ['在售:','最高价:' + param.data[5],'3/4分位数:' + param.data[4], '中位数:' + param.data[3], '1/4分位数:' + param.data[2],'最低价:' + param.data[1]].join('
')}""" content_function2 = """function(param) {return ['待售:','最高价:' + param.data[5],'3/4分位数:' + param.data[4], '中位数:' + param.data[3], '1/4分位数:' + param.data[2],'最低价:' + param.data[1]].join('
')}""" box = Boxplot(init_opts=opts.InitOpts(width='800px', height='400px', bg_color='white')) box.add_xaxis(['']).add_yaxis( # itemstyle_opts设置颜色,tooltip_opts设置标签的格式和颜色 '在售', box.prepare_data([is_sale_price.to_list()]), itemstyle_opts=opts.ItemStyleOpts(color='#4863C4'), tooltip_opts=opts.TooltipOpts(position='right', background_color='#4863C4', formatter=JsCode(content_function), is_always_show_content=True) ).add_yaxis( '待售', box.prepare_data([stay_sale_price.to_list()]), itemstyle_opts=opts.ItemStyleOpts(color='#FF9366'), tooltip_opts=opts.TooltipOpts(position='right', background_color='#FF9366', formatter=JsCode(content_function2), is_always_show_content=True) ).set_global_opts( title_opts=opts.TitleOpts(title='在售和待售楼盘价格分布', pos_left='300', pos_top='10', title_textstyle_opts=opts.TextStyleOpts(color='black', font_size=16)), legend_opts=opts.LegendOpts(pos_right='80', pos_top='50', orient='vertical') ).set_colors(['#4863C4', '#FF9366']).render('is_sale_price_box.html')- 1
- 2
- 3
- 4
- 5
- 6
- 7
- 8
- 9
- 10
- 11
- 12
- 13
- 14
- 15
- 16
- 17
- 18
- 19
- 20
- 21
- 22
- 23
- 24
- 25
- 26
- 27
- 28
在售楼盘的区域分布from pyecharts.charts import Map from pyecharts import options as opts import re df_new['位置'] = df_new['地址'].apply(lambda x: re.findall(r'\[(.*?)\]', x)[0]) df_new['位置'] = df_new['位置'].apply(lambda x: x[0:len(x)//2]) # 获取在售楼盘的位置信息 build_location = df_new.loc[df_new['是否在售']=='在售', '位置'].value_counts() data_pair = [['南明区', int(build_location['南明'])], ['云岩区', int(build_location['云岩'])], ['清镇市', int(build_location['清镇'])], ['白云区', int(build_location['白云'])], ['观山湖区', int(build_location['观山湖'])], ['修文县', int(build_location['修文'])], ['乌当区', int(build_location['乌当'])], ['花溪区', int(build_location['花溪'])], ['开阳县', int(build_location['开阳'])], ['息烽县', int(build_location['息烽'])]] map = Map(init_opts=opts.InitOpts(bg_color='black', width='1000px', height='700px')) map.add( '', data_pair=data_pair, maptype="贵阳" ).set_global_opts( title_opts=opts.TitleOpts(title='贵阳各区在售楼盘分布', pos_left='400', pos_top='50', title_textstyle_opts=opts.TextStyleOpts(color='white', font_size=16)), visualmap_opts=opts.VisualMapOpts(max_=30, is_piecewise=True, pos_left='100', pos_bottom='100', textstyle_opts=opts.TextStyleOpts(color='white', font_size=16)) ).render("sale_build_location.html")- 1
- 2
- 3
- 4
- 5
- 6
- 7
- 8
- 9
- 10
- 11
- 12
- 13
- 14
- 15
- 16
- 17
- 18
- 19
- 20
- 21
- 22
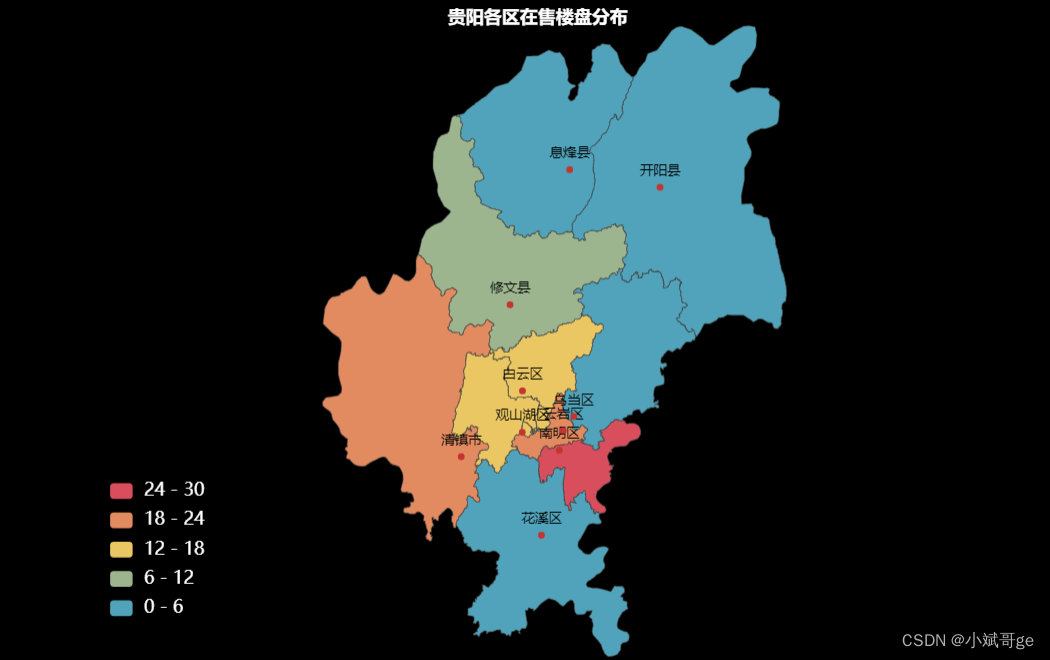
对在售楼盘的位置信息可视化,分布最多的是南明区,紧跟着是云岩区、清镇市、观山湖区、白云区。
在售单价Top20的楼盘from pyecharts.charts import Bar from pyecharts import options as opts df_new['单价'] = df_new['单价'].apply(lambda x: x.replace('售价待定,周边均价', '')) df_new['单价'] = df_new['单价'].values.astype(int) # 获取在售单价前20的楼盘价格和楼盘 is_sale_price_top20 = df_new.loc[df_new['是否在售']=='在售', '单价'].sort_values(ascending=False)[0:20] build_name_top20 = df_new.loc[is_sale_price_top20.index, '楼盘'] bar = Bar(init_opts=opts.InitOpts(width='1000px', height='400px', bg_color='white')) bar.add_xaxis( build_name_top20.to_list() ).add_yaxis( '', is_sale_price_top20.to_list(), category_gap=20 ).set_global_opts( title_opts=opts.TitleOpts(title='在售楼盘单价Top20(元/㎡)', pos_left='400', pos_top='30', title_textstyle_opts=opts.TextStyleOpts(color='black', font_size=16)), xaxis_opts=opts.AxisOpts(axislabel_opts=opts.LabelOpts(font_size=12, rotate=25, color='#4863C4')) ).set_colors('#4863C4').render('is_sale_top20_price.html')- 1
- 2
- 3
- 4
- 5
- 6
- 7
- 8
- 9
- 10
- 11
- 12
- 13
- 14
- 15
- 16
- 17
- 18

单价Top20楼盘的区域分布import re from pyecharts.charts import Pie from pyecharts import options as opts df_new['位置'] = df_new['地址'].apply(lambda x: re.findall(r'\[(.*?)\]', x)[0]) df_new['位置'] = df_new['位置'].apply(lambda x: x[0:len(x)//2]) df_new['单价'] = df_new['单价'].apply(lambda x: x.replace('售价待定,周边均价', '')) df_new['单价'] = df_new['单价'].values.astype(int) # 获取在售单价前20的楼盘价格和位置 is_sale_price_top20 = df_new.loc[df_new['是否在售']=='在售', '单价'].sort_values(ascending=False)[0:20] build_location_top20 = df_new.loc[is_sale_price_top20.index, '位置'].value_counts() pie = Pie(init_opts=opts.InitOpts(width='600px', height='400px', bg_color='white')) pie.add( '', [list(z) for z in zip([gen for gen in build_location_top20.index], build_location_top20)], radius=['35%', '60%'], center=['60%', '60%'] ).set_series_opts( label_opts=opts.LabelOpts(formatter="{b}: {c}"), ).set_global_opts( title_opts=opts.TitleOpts(title='在售单价Top20楼盘位置分布', pos_left='250', pos_top='50', title_textstyle_opts=opts.TextStyleOpts(color='black', font_size=16)), legend_opts=opts.LegendOpts(pos_left='50', pos_top='100', orient='vertical') ).render('build_location_top20.html')- 1
- 2
- 3
- 4
- 5
- 6
- 7
- 8
- 9
- 10
- 11
- 12
- 13
- 14
- 15
- 16
- 17
- 18
- 19
- 20
- 21
- 22

单价前20的楼盘主要分布在南明区、云岩区、观山湖区,说明这三个区是贵阳的核心区域。我们从中选择观山湖区,单独对该区域的楼盘进行分析。
观山湖区楼盘单价import re from pyecharts.charts import Bar from pyecharts import options as opts df_new['位置'] = df_new['地址'].apply(lambda x: re.findall(r'\[(.*?)\]', x)[0]) df_new['位置'] = df_new['位置'].apply(lambda x: x[0:len(x)//2]) # 获取观山湖在售的楼盘 is_sale_core = df_new[(df_new['是否在售']=='在售') & (df_new['位置']=='观山湖')] core_price = is_sale_core.copy() core_price.loc[:, '单价'] = core_price.loc[:, '单价'].apply(lambda x: int(x)) is_sale_core = core_price.sort_values('单价', ascending=False) bar = Bar(init_opts=opts.InitOpts(width='1000px', height='400px', bg_color='white')) bar.add_xaxis( is_sale_core['楼盘'].to_list() ).add_yaxis( '', is_sale_core['单价'].to_list(), category_gap=20 ).set_global_opts( title_opts=opts.TitleOpts(title='观山湖区在售楼盘单价(元/㎡)', pos_left='400', pos_top='30', title_textstyle_opts=opts.TextStyleOpts(color='black', font_size=16)), xaxis_opts=opts.AxisOpts(axislabel_opts=opts.LabelOpts(font_size=12, rotate=25, color='#4863C4')) ).set_colors('#4863C4').render('is_sale_core.html')- 1
- 2
- 3
- 4
- 5
- 6
- 7
- 8
- 9
- 10
- 11
- 12
- 13
- 14
- 15
- 16
- 17
- 18
- 19
- 20
- 21

观山湖区在售楼盘共16个,大部分单价在1W以上。前三名分别是中铁阅山湖云著、远大美域和中海映山湖。
观山湖区楼盘位置import folium from folium import Icon core_location = pd.read_excel('core_location_lng_lat.xlsx') map = folium.Map( # location设置地图显示的经纬度,初始经纬度选择与位置相近的,zoom_start设置放大倍数 location=[26.62, 106.61], zoom_start=13, attr='高德-常规图', # tiles用于设置不同类型的地图,这里使用高德的常规地图,个人觉得更美观 tiles='https://wprd01.is.autonavi.com/appmaptile?x={x}&y={y}&z={z}&lang=zh_cn&size=1&scl=1&style=7' ) # 标注每个楼盘的位置 for index in core_location.index: folium.Marker( location=[core_location.loc[index, '纬度'], core_location.loc[index, '经度']], # 经纬度 popup=core_location.loc[index, '楼盘'], # 鼠标悬停在标注点时显示的内容 # 设置标注图标的格式,icon可以参考提供Font-Awesome的网站,prefix需要与之匹配,参考Icon源码 icon=Icon(color='red', icon_color='white', icon='fa-heart', prefix='fa'), draggable=True # draggable设置为True,可以手动移动地图上的标注点,调整误差 ).add_to(map) map.save('core_location_map.html')- 1
- 2
- 3
- 4
- 5
- 6
- 7
- 8
- 9
- 10
- 11
- 12
- 13
- 14
- 15
- 16
- 17
- 18
- 19
- 20

位置标注需要先获取每个楼盘位置的经纬度,本文使用百度地图的API获取经纬度,然后保存到EXCEL文件core_location_lng_lat.xlsx中。具体获取经纬度的步骤和代码可以参考之前的文章:用Python展示全国高校的分布情况
观山湖区楼盘卖点展示import matplotlib.pyplot as plt df_new['位置'] = df_new['地址'].apply(lambda x: re.findall(r'\[(.*?)\]', x)[0]) df_new['位置'] = df_new['位置'].apply(lambda x: x[0:len(x)//2]) # 获取在售的观山湖区的楼盘 is_sale_core = df_new[(df_new['是否在售']=='在售') & (df_new['位置']=='观山湖')] plt.figure(figsize=(6, 6), dpi=100) # 绘制水平柱状图 plt.barh(is_sale_core['楼盘'].to_list(), [100 for _ in is_sale_core['标签'].to_list()], height=0.8) # 隐藏x轴和边框 plt.gca().get_xaxis().set_visible(False) for side in ['left', 'right', 'top', 'bottom']: plt.gca().spines[side].set_visible(False) plt.yticks(range(0, 16, 1), fontsize=10) # 设置标签显示格式,将内容显示成楼盘的买点描述 for a, b, c in zip(range(16), [100 for _ in is_sale_core['标签'].to_list()], is_sale_core['标签'].to_list()): plt.text(b-5, a, c, ha='right', va='center', fontsize=12, color='white') plt.title(" 观山湖在售楼盘卖点展示", fontsize=16, loc='left') plt.show()- 1
- 2
- 3
- 4
- 5
- 6
- 7
- 8
- 9
- 10
- 11
- 12
- 13
- 14
- 15
- 16
- 17
- 18
- 19

每条楼盘信息下都会有相关的信息标签,从这些信息标签里可以看出楼盘的卖点、修建进度等关键信息。
总结
本文获取了anjuke上贵阳市的新房数据,清洗数据后,对数据进行了逐层分析,并用Python进行可视化。
文中用到的Python库和工具以后会专门写文章详细介绍,对代码有疑问可以关注和联系我一起交流讨论,欢迎点赞、评论和收藏。 -
相关阅读:
pytorch的F.cross_entropy交叉熵函数和标签平滑函数
kobject 与sysfs属性文件读写
初识设计模式之单例模式
Eigen::svd和 np.linalg.svd的不同之处
仅仅只是用脱虚向实或者脱实向虚来诠释和表达产业互联网是不全面的
Flask 学习-49.Flask-RESTX 使用 namespaces 命名空间
02 kafka 记录的获取
理解“闭包”
react 也就这么回事 05 —— 组件 & Props
node包依赖下载管理
- 原文地址:https://blog.csdn.net/weixin_43790276/article/details/125988664
