-
百度地图数据可视化
如何使用百度地图
前往官方文档进行一系列注册,主要是为了获取服务密钥:

新建HTML文件,进行示例代码编写:DOCTYPE html> <html lang="en"> <head> <meta charset="UTF-8"> <meta name="viewport" content="width=device-width, initial-scale=1.0"> <title>Documenttitle> <style> html { height: 100%; } body { height: 100%; margin: 0px; padding: 0px; } #container { width: 400px; height: 400px; } .anchorBL, .BMap_cpyCtrl { display: none; /*隐藏百度地图的官网水印*/ } style> head> <body> <div id="container">div> body> <script type="text/javascript" src="https://api.map.baidu.com/api?v=1.0&type=webgl&ak=xnPUlI2jyZC0Rx61fa9OP9qzCTY3WTpH">script> <script> // 创建地图实例 var map = new BMapGL.Map("container"); // 设置中心点坐标 var point = new BMapGL.Point(116.404, 39.915); // 地图初始化,同时设置地图展示级别 map.centerAndZoom(point, 15); script> html>- 1
- 2
- 3
- 4
- 5
- 6
- 7
- 8
- 9
- 10
- 11
- 12
- 13
- 14
- 15
- 16
- 17
- 18
- 19
- 20
- 21
- 22
- 23
- 24
- 25
- 26
- 27
- 28
- 29
- 30
- 31
- 32
- 33
- 34
- 35
- 36
- 37
- 38
- 39
- 40
- 41
- 42
- 43
- 44
- 45
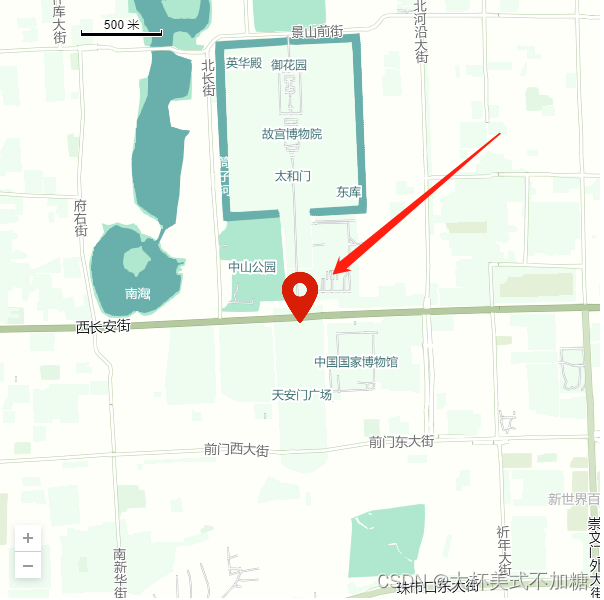
如图,就快速创建了一张以天安门为中心的地图:

异步加载
使用
window.onload以及百度地图的callback参数来实现,以减少首屏加载时间:<body> <div id="container">div> body> <script> function init() { var map = new BMapGL.Map("container"); var point = new BMapGL.Point(116.404, 39.915); map.centerAndZoom(point, 15); } window.onload = function() { var script = document.createElement('script'); // src 最后加一个callback参数,指定为init方法 script.src = 'https://api.map.baidu.com/api?v=1.0&type=webgl&ak=xnPUlI2jyZC0Rx61fa9OP9qzCTY3WTpH&callback=init'; document.body.appendChild(script); } script> html>- 1
- 2
- 3
- 4
- 5
- 6
- 7
- 8
- 9
- 10
- 11
- 12
- 13
- 14
- 15
- 16
- 17
- 18
- 19
3D地图
可以使用 heading 和 tilt 属性控制地图的旋转角度和俯角
<script> function init() { var map = new BMapGL.Map("container"); var point = new BMapGL.Point(116.404, 39.915); map.centerAndZoom(point, 15); map.setHeading(30); map.setTilt(75); } window.onload = function() { var script = document.createElement('script'); script.src = 'https://api.map.baidu.com/api?v=1.0&type=webgl&ak=xnPUlI2jyZC0Rx61fa9OP9qzCTY3WTpH&callback=init' document.body.appendChild(script) } script>- 1
- 2
- 3
- 4
- 5
- 6
- 7
- 8
- 9
- 10
- 11
- 12
- 13
- 14

3D地球
通过
setMapType(BMAP_EARTH_MAP)来开启地球视图:<script> function init() { var map = new BMapGL.Map("container"); var point = new BMapGL.Point(116.404, 39.915); map.centerAndZoom(point, 15); map.setHeading(0); map.setTilt(0); map.setMapType(BMAP_EARTH_MAP); } window.onload = function() { var script = document.createElement('script'); script.src = 'https://api.map.baidu.com/api?v=1.0&type=webgl&ak=xnPUlI2jyZC0Rx61fa9OP9qzCTY3WTpH&callback=init' document.body.appendChild(script) } script>- 1
- 2
- 3
- 4
- 5
- 6
- 7
- 8
- 9
- 10
- 11
- 12
- 13
- 14
- 15
这个setMapType方法中的常量有两个,一个是
BMAP_NORMAL_MAP,即普通街道视图。一个就是BMAP_EARTH_MAP,即地球卫星视图。
百度地图控件
放大缩小控件
通过以下代码来引入:
<script> function init() { var map = new BMapGL.Map("container"); var point = new BMapGL.Point(116.404, 39.915); map.centerAndZoom(point, 15); map.setMapType(BMAP_NORMAL_MAP); let zoomCtrl = new BMapGL.ZoomControl(); map.addControl(zoomCtrl); } window.onload = function() { var script = document.createElement('script'); script.src = 'https://api.map.baidu.com/api?v=1.0&type=webgl&ak=xnPUlI2jyZC0Rx61fa9OP9qzCTY3WTpH&callback=init' document.body.appendChild(script) } script>- 1
- 2
- 3
- 4
- 5
- 6
- 7
- 8
- 9
- 10
- 11
- 12
- 13
- 14
- 15

调整放大缩小组件的位置
通过往
ZoomControl中传入offset参数来实现:let zoomCtrl = new BMapGL.ZoomControl({ anchor: BMAP_ANCHOR_BOTTOM_LEFT, // 表示控件定位于地图的左下角 offset: new BMapGL.Size(0, 0) // 控件位置偏移 });- 1
- 2
- 3
- 4

调整最大与最小缩放比例
const map = new BMapGL.Map('container'); map.setMinZoom(8); // 3.0版本不可用 map.setMaxZoom(12); // 3.0版本不可用 // or const map = new BMapGL.Map('container', { minZoom: 8, maxZoom: 12, mapType: BMAP_NORMAL_MAP });- 1
- 2
- 3
- 4
- 5
- 6
- 7
- 8
- 9
比例尺控件
var scaleCtrl = new BMapGL.ScaleControl({ anchor: BMAP_ANCHOR_TOP_LEFT // 不加这个默认参数的话比例尺会显示不出来 }); map.addControl(scaleCtrl);- 1
- 2
- 3
- 4

自定义样式
可以到百度地图 个性化地图 去配置自己想要的颜色样式:
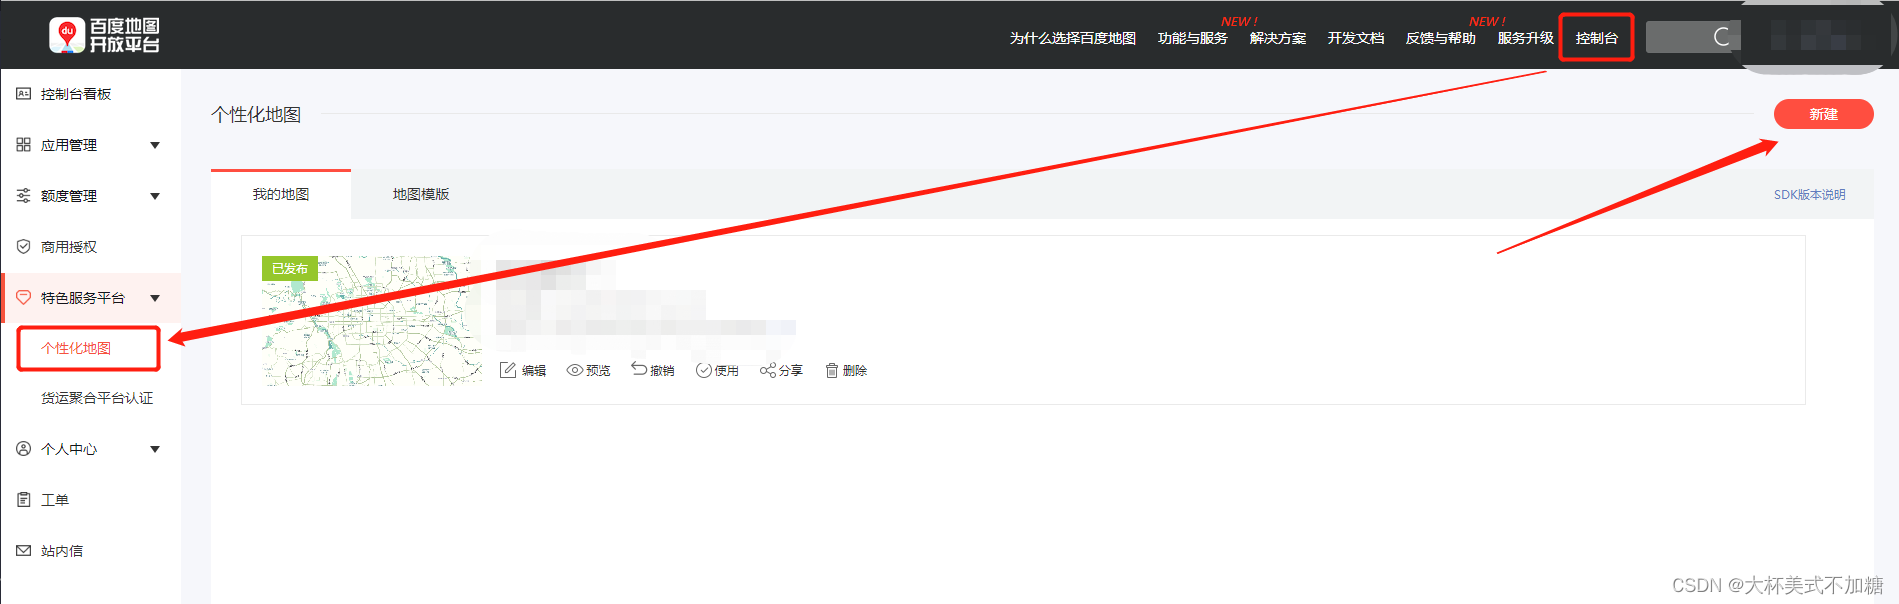
可以使用模板,也可以自己进行自定义,然后点击发布样式:
点击发布后会获得一个样式ID,将其复制下来:
接下来就可以在JavaScript API中应用地图样式了(注意:发布的styleID需要与ak为同一个用户):map.setMapStyleV2({ styleId: 'XXXXXXXXXXXXXXXXXXX' });- 1
- 2
- 3
还有一种是通过编写样式 JSON 文件的方式,由于数据量比较大且不直观,推荐还是使用样式ID的方式:

百度地图绘图
绘制图标
Marker是一个用来往地图上添加点标记的类。使用它将任何你希望用户看到的兴趣点标注在地图上。
API提供了默认图标样式,您也可以通过Icon类来指定自定义图标。Marker的构造函数的参数为Point和MarkerOptions(可选)。
注意:当您使用自定义图标时,标注的地理坐标点将位于标注所用图标的中心位置,您可通过Icon的offset属性修改标定位置。定义标注图标 通过Icon类可实现自定义标注的图标,下面示例通过参数MarkerOptions的icon属性进行设置:
<script> var map = new BMapGL.Map("container"); var point = new BMapGL.Point(116.404, 39.915); var myIcon = new BMapGL.Icon('./images/location.png', new BMapGL.Size(60, 60), {}); // 创建标注对象并添加到地图 var marker = new BMapGL.Marker(point, {icon: myIcon}); map.addOverlay(marker); </script>- 1
- 2
- 3
- 4
- 5
- 6
- 7
- 8
绘制线段
折线覆盖物可以分别设置描边粗细、颜色、填充颜色等属性:
var polyline = new BMapGL.Polyline([ new BMapGL.Point(116.399, 39.910), new BMapGL.Point(116.405, 39.920), new BMapGL.Point(116.425, 39.900) ]); map.addOverlay(polyline);- 1
- 2
- 3
- 4
- 5
- 6

像前面的图标绘制也是有很多属性可以配置的,详情的可以查看官方API文档绘制多边形
var polygon = new BMapGL.Polygon([ new BMapGL.Point(116.387112, 39.920977), new BMapGL.Point(116.385243, 39.913063), new BMapGL.Point(116.394226, 39.917988) ], { strokeColor: "blue", strokeWeight: 2, strokeOpacity: 0.5, fillColor: 'pink' }); map.addOverlay(polygon);- 1
- 2
- 3
- 4
- 5
- 6
- 7
- 8
- 9
- 10
- 11

文本标注
API提供了默认的标注样式,也可以通过setStyle来指定自定义样式:
var content = "这是一段文本标注"; var label = new BMapGL.Label(content, { // 创建文本标注 position: point, // 设置标注的地理位置 offset: new BMapGL.Size(10, 20) // 设置标注的偏移量 }); map.addOverlay(label); // 将标注添加到地图中 label.setStyle({ // 设置label的样式 color: '#000', fontSize: '30px', border: '2px solid #1E90FF' });- 1
- 2
- 3
- 4
- 5
- 6
- 7
- 8
- 9
- 10
- 11

信息窗口
信息窗口也是一种特殊的覆盖物,它可以展示更为丰富的文字和多媒体信息。注意:同一时刻只能有一个信息窗口在地图上打开
var opts = { width: 250, // 信息窗口宽度 height: 100, // 信息窗口高度 title: "Hello" // 信息窗口标题 } var infoWindow = new BMapGL.InfoWindow("World", opts); // 创建信息窗口对象 map.openInfoWindow(infoWindow, map.getCenter()); // 打开信息窗口- 1
- 2
- 3
- 4
- 5
- 6
- 7

常用的是配合marker进行点击展开窗口的功能:// 创建标注对象并添加到地图 var marker = new BMapGL.Marker(point, {icon: myIcon}); map.addOverlay(marker); var opts = { width: 250, // 信息窗口宽度 height: 100, // 信息窗口高度 title: "Hello" // 信息窗口标题 } var infoWindow = new BMapGL.InfoWindow("World", opts); // 创建信息窗口对象 marker.addEventListener('click', function() { map.openInfoWindow(infoWindow, map.getCenter()); // 打开信息窗口 });- 1
- 2
- 3
- 4
- 5
- 6
- 7
- 8
- 9
- 10
- 11
- 12

其中InfoWindow的第一个参数可以以字符串的形式直接传入HTML:var opts = { width: 250, // 信息窗口宽度 height: 100, // 信息窗口高度 title: "Hello" // 信息窗口标题 } var content = 'World'; // 传入HTML var infoWindow = new BMapGL.InfoWindow(content, opts); marker.addEventListener('click', function() { map.openInfoWindow(infoWindow, map.getCenter()); });- 1
- 2
- 3
- 4
- 5
- 6
- 7
- 8
- 9
- 10

百度地图 viewAnimation 动画
通过
new BMapGL.ViewAnimation(keyFrames, opts)去定义一个动画,其中 keyFrames 是一个数组,定义了关键帧,关键帧以一个对象数组的形式定义,每一个关键帧作为该数组的一个对象成员,以对象字面量的形式传入。而 opts 设置了动画属性,动画属性以一个对象的形式定义,每一种属性对应该对象的一个属性。
然后通过
startViewAnimation方法去开始动画。可以参照官方文档中动画的示例,这里就不放代码了,总之动画效果还是挺不错的,比用定时来完成动画的效果很好很多。
百度地图 TrackAnimation 动画
不同于前面的 viewAnimation 动画,TrackAnimation 动画是轨迹动画,而前面的动画是一个类似 CSS 的 keyFrames 动画。
同样的参照官方文档中 TrackAnimation 动画的示例就可以了
需要注意的是官方文档中v1.0的 API 并没有 TrackAnimation 相关的,使用该动画需要额外引入开源库BMapGLLib.TrackAnimation,这点文档示例中也有提到。
百度地图可视化(散点图、飞线图等等)
这里使用的是 MapVGL,MapVGL 是一款基于 WebGL 的地理信息可视化库,可以用来展示大量基于3D的地理信息点线面数据。设计初衷主要是为了解决大数据量的三维地理数据展示问题及一些炫酷的三维效果。
更多效果可以参见官方文档
-
相关阅读:
常规性能调优RDD优化_大数据培训
VUE POST请求 参数出现在URL上
Codeforce 8.15-8.22做题记录
报错:NegativeArraySizeException
【北京迅为】《i.MX8MM嵌入式Linux开发指南》-第一篇 嵌入式Linux入门篇-第二十八章 借助U盘或TF卡拷贝程序到开发板上
2023最新SSM计算机毕业设计选题大全(附源码+LW)之java扶贫助农系统v7tq9
宝宝喝奶粉过敏怎么办?
Linux ARM平台开发系列讲解(IPCF异核通信) 2.11.3 IPCF异核通信驱动编译及其测试
如何实现PLC点对点、点对多点组网通信?
使用C++实现尾插式循环链表结构
- 原文地址:https://blog.csdn.net/qq_40988677/article/details/125862083
