-
爱上开源之golang入门至实战第三章-性能分析-Heap

Heap Memory
Heap: A sampling of memory allocations of live objects. You can specify the gc GET parameter to run GC before taking the heap sample.
添加gc这个parameter到get的url里, 可以在采样之前强制执行一次GC后,再进行采样;来之pprof.go(net/http/pprof.go)源码

Heap的手工埋点
如果是Run over Once的工具包,需要自己进行手工埋点的话, 大致的方法和上面CPU Profiling的埋点方式一致,只是需要调用不同的pprof的方法即可; 对于Heap埋点,调用
pprof.WriteHeapProfile- if err := pprof.WriteHeapProfile(f1); err != nil {
- panic("could not start heap-1 profile: ")
- }
-
pprof工具Heap分析
运行命令
go tool pprof http://localhost:8999/debug/pprof/heap

使用top命令,查看内存占用最多的地方

Top命令的结果,列表出了在采样的快照,发生的程序中各种函数调用过程中内存占用最多的函数调用;
其中每一行都表示一个采用到的函数调用,
每类都对应着采集到的数据分析; 列的参照如下
flat:函数在调用中内存占用数量
flat%:函数在调用中内存占用的百分比
sum%:所有函数累加使用内存的比例,即所有flat%的总和
cum: 函数以及子函数运行所使用内存,应该大于等于flat
cum%: 函数以及子函数运行所使用内存的比例,应该大于等于flat%
函数的名字
这里可以看到调用现在内存占用最多的占用内存60MB, 占所有内存总量的99.15%,main.startHttpServer.func3, 这个函数的调用占用的内存基本上就是所有的内存, 这个函数究竟做了哪些动作,导致内存的占用, 我们可以在pprof里运行list命令, 进一步进行分析
使用pprof命令:list 函数名。 可以用pprof分析函数中的哪一行导致的内存占用
- (pprof) list func3
- Total: 60.52MB
- ROUTINE ======================== main.startHttpServer.func3 in E:\WORK\PROJECT\git\go\gohutool\boot4go-docker-ui\docker.ui.go
- 60MB 60MB (flat, cum) 99.15% of Total
- . . 180:
- . . 181: if len(testPool) >= POOLSIZE {
- . . 182: testPool = testPool[0:0]
- . . 183: }
- . . 184:
- 60MB 60MB 185: testPool = append(testPool, make([]byte, SIZE))
- . . 186:
- . . 187: return nil
- . . 188: })
- . . 189:
- . . 190: router.Any("/debug/pprof/*", func(ctx *routing.Context) error {
通过这个命令,可以直接追击到源代码的行数,从而进行仔细的调用过程分析

代码185行: make([]byte, SIZE) 进行了内存的操作, 这里的60M全部这里进行操作的。
使用图形化web命令进行分析
在pprof的交互模式里输入web命令

使用tree命令查看
- (pprof) tree
- Showing nodes accounting for 206.50MB, 99.28% of 208MB total
- Dropped 15 nodes (cum <= 1.04MB)
- ----------------------------------------------------------+-------------
- flat flat% sum% cum cum% calls calls% + context
- ----------------------------------------------------------+-------------
- 204MB 100% | github.com/qiangxue/fasthttp-routing.(*Context).Next
- 204MB 98.08% 98.08% 204MB 98.08% | main.startHttpServer.func3
- ----------------------------------------------------------+-------------
- 2.50MB 100% | runtime.newm
- 2.50MB 1.20% 99.28% 2.50MB 1.20% | runtime.allocm
- ----------------------------------------------------------+-------------
- 204MB 100% | github.com/qiangxue/fasthttp-routing.(*Router).HandleRequest
- 0 0% 99.28% 204MB 98.08% | github.com/qiangxue/fasthttp-routing.(*Context).Next
- 204MB 100% | main.startHttpServer.func3
- ----------------------------------------------------------+-------------
- 204MB 100% | main.startHttpServer.func8
- 0 0% 99.28% 204MB 98.08% | github.com/qiangxue/fasthttp-routing.(*Router).HandleRequest
- 204MB 100% | github.com/qiangxue/fasthttp-routing.(*Context).Next
- ----------------------------------------------------------+-------------
- 204MB 100% | github.com/valyala/fasthttp.(*workerPool).workerFunc
- 0 0% 99.28% 204MB 98.08% | github.com/valyala/fasthttp.(*Server).serveConn
- 204MB 100% | main.startHttpServer.func8
- ----------------------------------------------------------+-------------
- 0 0% 99.28% 204MB 98.08% | github.com/valyala/fasthttp.(*workerPool).getCh.func1
- 204MB 100% | github.com/valyala/fasthttp.(*workerPool).workerFunc
- ----------------------------------------------------------+-------------
- 204MB 100% | github.com/valyala/fasthttp.(*workerPool).getCh.func1
- 0 0% 99.28% 204MB 98.08% | github.com/valyala/fasthttp.(*workerPool).workerFunc
- 204MB 100% | github.com/valyala/fasthttp.(*Server).serveConn
- ----------------------------------------------------------+-------------
- 204MB 100% | github.com/valyala/fasthttp.(*Server).serveConn
- 0 0% 99.28% 204MB 98.08% | main.startHttpServer.func8
- 204MB 100% | github.com/qiangxue/fasthttp-routing.(*Router).HandleRequest
- ----------------------------------------------------------+-------------
- 0 0% 99.28% 2MB 0.96% | runtime.mstart
- 2MB 100% | runtime.mstart0
- ----------------------------------------------------------+-------------
- 2MB 100% | runtime.mstart
- 0 0% 99.28% 2MB 0.96% | runtime.mstart0
- 2MB 100% | runtime.mstart1
- ----------------------------------------------------------+-------------
- 2MB 100% | runtime.mstart0
- 0 0% 99.28% 2MB 0.96% | runtime.mstart1
- 2MB 100% | runtime.schedule
- ----------------------------------------------------------+-------------
- 2.50MB 100% | runtime.startm
- 0 0% 99.28% 2.50MB 1.20% | runtime.newm
- 2.50MB 100% | runtime.allocm
- ----------------------------------------------------------+-------------
- 2.50MB 100% | runtime.schedule
- 0 0% 99.28% 2.50MB 1.20% | runtime.resetspinning
- 2.50MB 100% | runtime.wakep
- ----------------------------------------------------------+-------------
- 2MB 80.00% | runtime.mstart1
- 0 0% 99.28% 2.50MB 1.20% | runtime.schedule
- 2.50MB 100% | runtime.resetspinning
- ----------------------------------------------------------+-------------
- 2.50MB 100% | runtime.wakep
- 0 0% 99.28% 2.50MB 1.20% | runtime.startm
- 2.50MB 100% | runtime.newm
- ----------------------------------------------------------+-------------
- 2.50MB 100% | runtime.resetspinning
- 0 0% 99.28% 2.50MB 1.20% | runtime.wakep
- 2.50MB 100% | runtime.startm
- ----------------------------------------------------------+-------------
对比一下func3和func8
- (pprof) list func3
- Total: 208MB
- ROUTINE ======================== main.startHttpServer.func3 in E:\WORK\PROJECT\git\go\gohutool\boot4go-docker-ui\docker.ui.go
- 204MB 204MB (flat, cum) 98.08% of Total
- . . 180:
- . . 181: if len(testPool) >= POOLSIZE {
- . . 182: testPool = testPool[0:0]
- . . 183: }
- . . 184:
- 204MB 204MB 185: testPool = append(testPool, make([]byte, SIZE))
- . . 186:
- . . 187: return nil
- . . 188: })
- . . 189:
- . . 190: router.Any("/debug/pprof/*", func(ctx *routing.Context) error {
- (pprof) list func8
- Total: 208MB
- ROUTINE ======================== main.startHttpServer.func8 in E:\WORK\PROJECT\git\go\gohutool\boot4go-docker-ui\docker.ui.go
- 0 204MB (flat, cum) 98.08% of Total
- . . 248:
- . . 249: Logger.Debug("router.HandleRequest is finish")
- . . 250:
- . . 251: }()
- . . 252:
- . 204MB 253: router.HandleRequest(ctx)
- . . 254: }
- . . 255:
- . . 256: //go http.ListenAndServe("0.0.0.0:8887", nil)
- . . 257:
- . . 258: // Start HTTP server.
-
heap提供了对内存进行分析的途径,通过对内存的占用量的分析,我们可以结合着程序的压力测试,对程序的内存泄漏进行排查和分析,对内存只增不减的等可疑情况地方,进行排查,最终发现问题
heap的pprof样本中的数据项
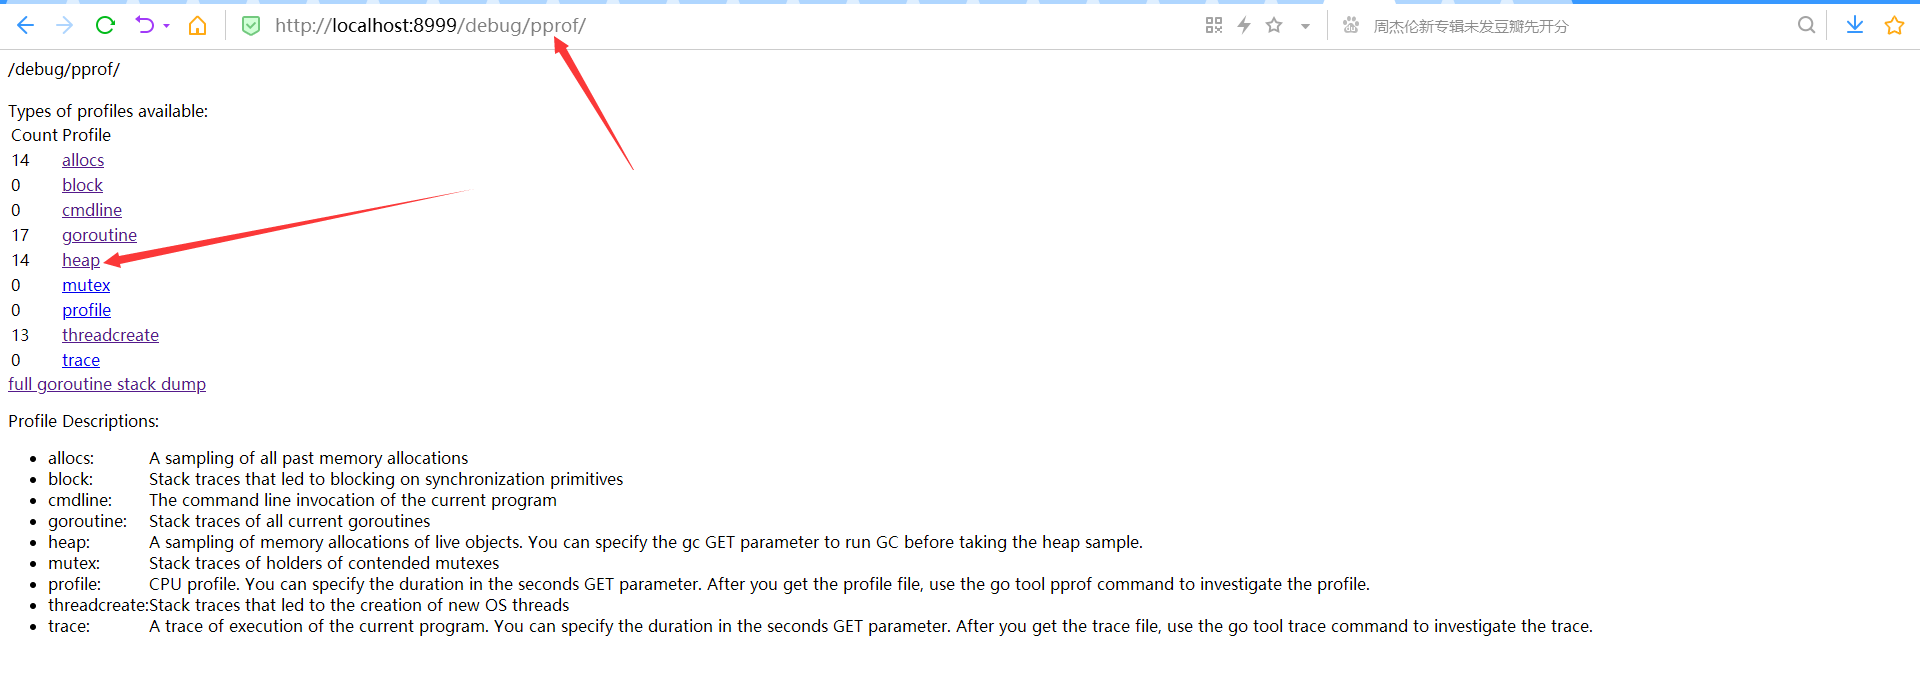
通过http://localhost:8999/debug/pprof/可以查看heap的信息


技巧这些信息是样本中的数据项,相对于我们通过web访问时,访问当前时间的heap的一个快照; 熟悉这些数据项所表示的含义,也非常对我们了解当前程序运行时的内存情况非常有帮助。
这里对应的样本的输出的源代码可以参考
net/http/pprof/pprof.go,runtime/pprof/pprof.go和runtime/mstats.go


-
相关阅读:
工作小记 编译 ffmpeg gpu 版本
vue+ts做一个类似课程表
linux安装Chrome跑web自动化
有了低代码,二次开发都不是事!
go 1.18新特性(泛性 模糊测试 WorkSpace)
Anaconda的升级、配置及使用
Windows使用小技巧
Redis系列:Redis持久化机制与Redis事务
Flutter iOS上架指南
【Vue Router的路由模式】
- 原文地址:https://blog.csdn.net/inthirties/article/details/125595978
