-
快速上手prometheaus grafana 监控
介绍
prometheaus 一个定时输出指标数据的巡检组件?
grafana 一个读取指标,可视化的提供了好看界面的组件?教程
如何和springboot项目集成 【IT老齐153】超级实用!十分钟掌握Prometheus与Grafana监控SpringBoot应用_哔哩哔哩_bilibili
- 其中用到了docker来引入Prometheus与Grafana,我直接跟着底下教程 本机安装了,
- 学到了 springboot项目暴露监控指标的配置(配置文件放在最后)
如何监控windows【小速通】速通windows平台部署prometheus+grafana监控自机_哔哩哔哩_bilibili
四分钟的教程
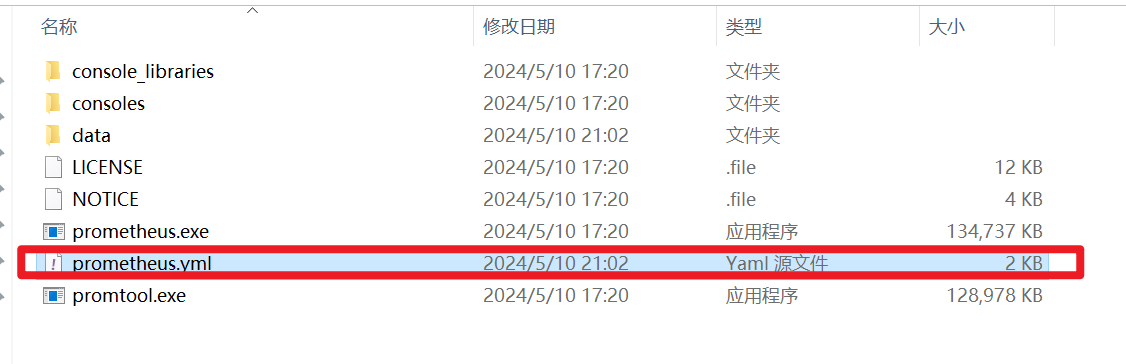
安装了个windows_exporter 可以让普罗米修斯监听windows的性能指标配置文件
global: scrape_interval: 15s # Set the scrape interval to every 15 seconds. Default is every 1 minute. evaluation_interval: 15s # Evaluate rules every 15 seconds. The default is every 1 minute. alerting: alertmanagers: - static_configs: - targets: # - alertmanager:9093 rule_files: # - "second_rules.yml" scrape_configs: - job_name: "prometheus" static_configs: - targets: ["localhost:9090"] #windows_exporter的配置 - job_name: "windows_exporter" static_configs: - targets: ["localhost:9182"] #springboot项目的配置 - job_name: "springboot_prometheus" scrape_interval: 5s metrics_path: '/actuator/prometheus' static_configs: - targets: ['localhost:81']- 1
- 2
- 3
- 4
- 5
- 6
- 7
- 8
- 9
- 10
- 11
- 12
- 13
- 14
- 15
- 16
- 17
- 18
- 19
- 20
- 21
- 22
- 23
- 24
- 25
- 26
- 27
- 28


pom文件

#springboot yaml 配置 spring: application: name: springboot-prometheus management: endpoints: web: exposure: include: "*" endpoint: health: show-details: always prometheus: enabled: true metrics: export: prometheus: enabled: true server: port: 81- 1
- 2
- 3
- 4
- 5
- 6
- 7
- 8
- 9
- 10
- 11
- 12
- 13
- 14
- 15
- 16
- 17
- 18
- 19
- 20
- 21
- 22
实操截图
-
springboot项目 actuator本身可以暴露出来的指标

-
加了prometheus依赖后,可以更规范的返回

-
上述这个项目的监控界面(用的dashboard id是 4701)

-
windows_exporter的监控界面(搜windows_exporter 第一个)

开源项目地址
-
相关阅读:
学习笔记4——JVM运行时数据区梳理
论文阅读-ATLAS: A Sequence-based Learning Approach for Attack Investigation
Linux下安装Redis
webpack高级应用篇(十五):基于 Promise 的动态 Remote,让模块联邦版本化
Qt项目移植到mac上一些问题汇总
《向量数据库指南》——Milvus Cloud当初为什么选择向量数据库这个赛道呢?
【笔试刷题训练】day_13
10月20日,每日信息差
【数据挖掘 | 关联性分析】万字长文详解关联性分析,详解Apriori算法为例,确定不来看看?
JWT简介& JWT结构& JWT示例& 前端添加JWT令牌功能& 后端程序
- 原文地址:https://blog.csdn.net/aiwandianao/article/details/138682491
