-
echarts-liquidfill水球图教程
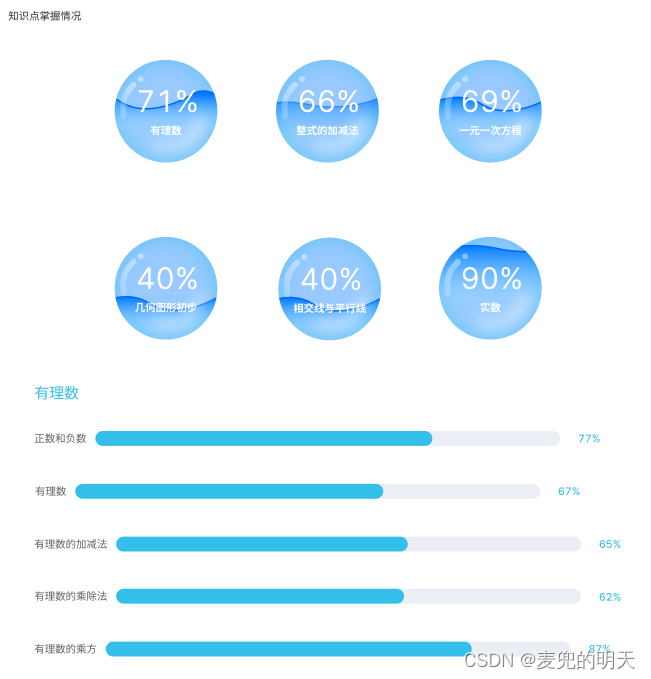
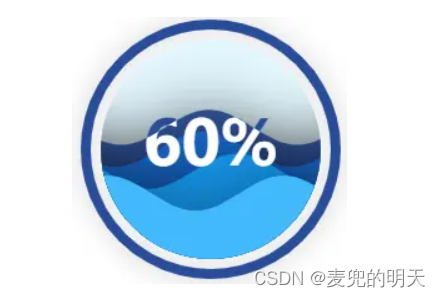
接到了一个水球图的需求,如上图所示,点击不同的水球,下面的进度条呈现不同维度的百分比情况 。
第一步,安装插件
- npm install echarts
- npm install echarts-liquidfill
注意在这里需要查看echarts版本是4还是5,echarts@5的版本与echarts-liquidfill@3兼容,echarts@4的版本与echarts-liquidfill@2兼容,如果版本不对应,会报错!!!因为我踩坑了😂我的echarts版本是4.9.0,装的依赖是最新版的,也就是echarts-liquidfill@3,后来就报错了,然后看官网发现得用2的,我就下载了echarts-liquidfill@2.0.6版本的。
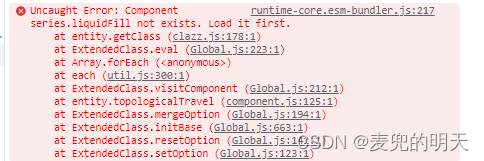
报错1:echart--Uncaught Error: Component series.wordCloud not exists. Load it first.
解决办法:先检查echarts 和 echarts-liquidfill 是否安装 echarts 4.几的版本对应 liquidfill 2.0.6的版本
第二步,引入
- import * as echarts from 'echarts';
- import 'echarts-liquidfill'
以下是我封装的简单粗糙的组件
- <template>
- <div>
- <div id="waterPoloChart" ref="waterPoloChart" :style="{ width: chartWidth, height: chartHeight }" />
- </div>
- </template>
- <script>
- import * as echarts from "echarts";
- import 'echarts-liquidfill'
- export default {
- props: {
- chartData: {
- type: Object,
- default: () => { },
- },
- chartWidth: {
- type: String,
- default: "",
- },
- chartHeight: {
- type: String,
- default: "",
- },
- },
- data () {
- return {
- };
- },
- created () {
- },
- computed: {
- chartOptions () {
- // let that = this
- const options = {
- title: {
- left: 'center',
- subtext: this.chartData.name,
- subtextStyle: { //文字样式
- color: "#fff",
- fontSize: 14,
- fontWeight: 600,
- // bottom: "center"
- },
- itemGap: 10, //主副标题间距
- bottom: 25,
- textStyle: {
- color: '#333',
- fontWeight: 'normal',
- fontSize: 14
- }
- },
- series: [{
- // name: '水球图',
- type: 'liquidFill',
- radius: '96%',
- center: ['50%', '50%'],
- waveAnimation: 10, // 动画时长
- amplitude: 20, // 振幅
- data: [this.chartData.value], // 使用合并后的数据
- // data: [0.7],//水球百分比
- color: 'rgba(68, 197, 253,1)',//设置波形颜色
- label: {
- normal: {
- color: '#fff',//百分比颜色
- textStyle: {
- fontSize: 16,
- fontWeight: 'normal'
- }
- }
- },
- outline: { //外边框
- show: false,
- borderDistance: 5,
- itemStyle: {
- borderColor: 'rgba(68, 197, 253,1)',
- borderWidth: 2
- }
- },
- backgroundStyle: { //水球背景色
- color: '#87cbfa'
- }
- }]
- }
- return options;
- }
- },
- mounted () {
- console.log(this.chartData, 'this.chartData')
- // this.$nextTick(() => {
- // this.initEcharts();
- if (this.chartData !== null && this.chartData !== undefined) {
- this.initEcharts();
- }
- // });
- },
- methods: {
- // initChart () {
- // const _this = this;
- // _this.waterPoloChart = echarts.init(this.$refs.waterPoloChart);
- // window.addEventListener("resize", function () {
- // _this.waterPoloChart.resize();
- // });
- // },
- initEcharts () {
- // 初始化echarts实例
- const _this = this;
- _this.waterPoloChart = echarts.init(this.$refs.waterPoloChart);
- // 显示图表
- _this.waterPoloChart.setOption(this.chartOptions);
- },
- }
- }
- </script>
- <style lang='less' scoped></style>
以下的是父组件,引入注册之后直接使用上面的组件 并且传入数据和水球图的宽高
- <template>
- <div class="compClass">
- <div class="compClass-kno">
- <h3>知识点掌握情况</h3>
- <div class="compClass-kno-bubble">
- <div style="display: flex;justify-content: center;" v-for="(item, index) in chartData" :key="index"
- @click="clickBubble(item)">
- <waterPoloChart :chartData="item" :chartHeight="chartHeight" :chartWidth="chartWidth">
- </waterPoloChart>
- </div>
- </div>
- <div class="compClass-kno-chart">
- <h3 style="color: #34BEEA;font-size: 20px;font-weight: 500;margin-bottom: 40px;">{{ knoChartTitle }}</h3>
- <div class="progress-status">
- <span>{{ title }}</span>
- <span id="progressBarContainer">
- <span id="progressBar" :style="{ width: progressBarWidth }"></span>
- </span>
- <span>{{ progressBarWidth }}</span>
- </div>
- </div>
- </div>
- </div>
- </template>
- <script>
- import waterPoloChart from '../components/waterPoloChart.vue'
- export default {
- components: {
- waterPoloChart,
- },
- data () {
- return {
- chartHeight: '138px',
- chartWidth: '138px',
- chartData: [
- { value: 0.5, name: "有理数", title: '无理数', cat: '50%' },
- { value: 0.6, name: "整数", title: '小数', cat: '60%' },
- { value: 0.2, name: "方程", title: '一元一次方程', cat: '20%' },
- { value: 0.7, name: "几何", title: '勾股定理', cat: '70%' },
- { value: 0.3, name: "实数", title: '实数1', cat: '30%' },
- { value: 0.9, name: "相交平行线", title: '平行线永不相交', cat: '90%' },
- ],
- knoChartTitle: '有理数',
- title: '整数',
- progressBarWidth: '50%'//进度条占比
- };
- },
- methods: {
- clickBubble (item) {
- this.knoChartTitle = item.name;
- this.title = item.title
- this.progressBarWidth = item.cat;
- console.log(this.progressBarWidth, '8888')
- },
- },
- };
- </script>
- <style lang="scss">
- .compClass {
- >div {
- background: #fff;
- margin-bottom: 16px;
- }
- &-kno {
- padding: 16px 20px;
- &-bubble {
- display: flex;
- flex-wrap: wrap;
- justify-content: flex-start;
- margin-top: 32px;
- >div {
- cursor: pointer;
- width: 33%;
- text-align: center;
- margin-bottom: 50px;
- }
- }
- &-chart {
- .progress-status {
- margin-bottom: 50px;
- display: flex;
- align-items: center;
- #progressBarContainer {
- display: inline-block;
- margin: 0 24px 0 12px;
- position: relative;
- width: 625px;
- // border: 1px #669CB8 solid;
- height: 20px;
- border-radius: 10px;
- background-color: #E1E9EE;
- // background: -webkit-gradient(linear, 0 0, 0 100%, from(#E1E9EE), to(white));
- #progressBar {
- position: absolute;
- top: 0;
- left: -1px;
- background-color: #7BC3FF;
- // width: 0%;
- height: 20px;
- border-radius: 10px;
- // transition: width 1s ease-in-out;
- }
- }
- }
- }
- }
- }
- </style>
粗糙的实现情况如下:
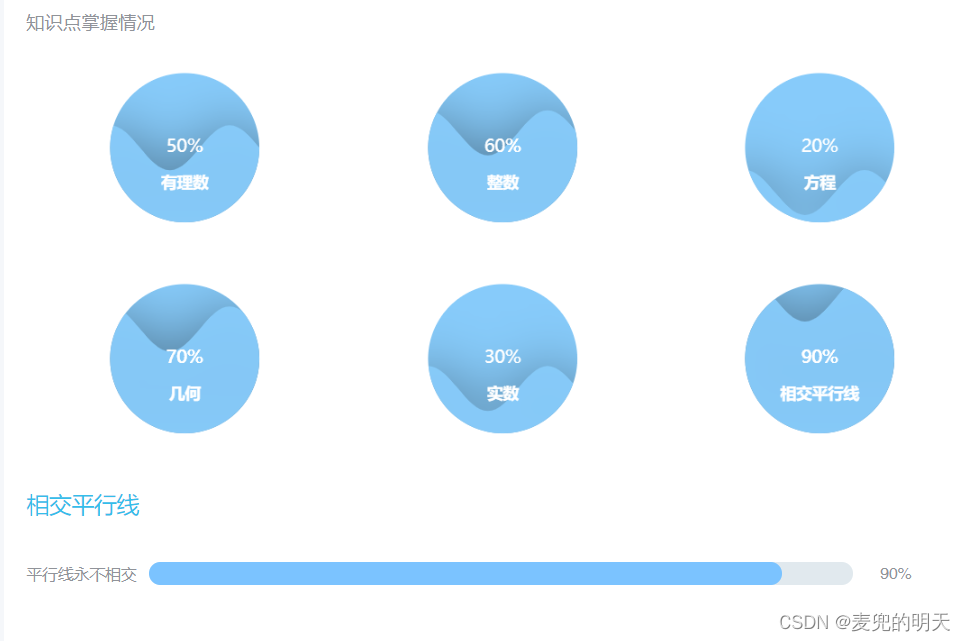
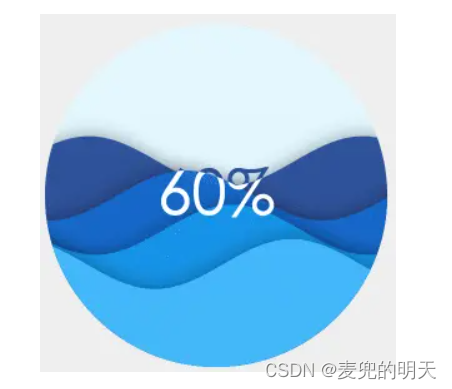
1.简单示例
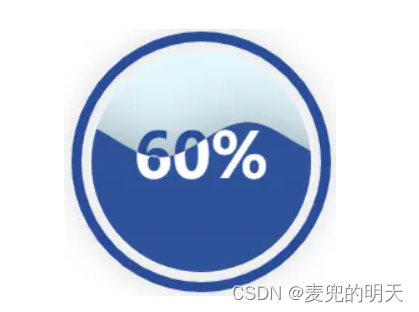
- <!DOCTYPE html>
- <html>
- <head>
- <title>水球图</title>
- <script type="text/javascript" src="echarts.min.js"></script>
- <script type="text/javascript" src="echarts-liquidfill.min.js"></script>
- </head>
- <body>
- <div id="app" style="width: 100%;height: 400px"></div>
- <script type="text/javascript">
- var myChart = echarts.init(document.getElementById('app'));
- var option = {
- series: [{
- type: 'liquidFill',
- data: [0.6]
- }]
- };
- myChart.setOption(option);
- </script>
- </body>
- </html>
2.定制化水球图
2.1 多个波形
将多个波形表示出来,既可以表示多个数据,也可以提高图表的视觉效果。
- var option = {
- series: [{
- type: 'liquidFill',
- data: [0.6, 0.5, 0.4, 0.3]
- }]
- };
0.6,0.5,0.4,0.3表示分别在60%,50%,40%,30%处各有一个波形
要几个波形,data值就写几个2.2 设置波形的颜色,透明度
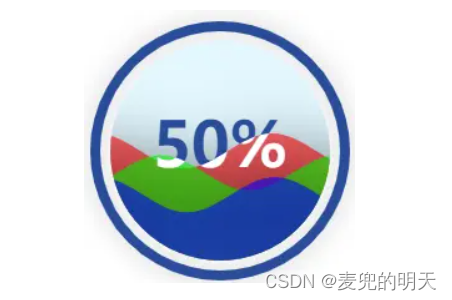
- var option = {
- series: [{
- type: 'liquidFill',
- data: [0.5, 0.4, 0.3],
- color: ['red', '#0f0', 'rgb(0, 0, 255)'],//设置波形颜色
- itemStyle: {
- opacity: 0.6//设置normal时候的透明度
- },
- emphasis: {
- itemStyle: {
- opacity: 0.9//设置hover时候的透明度
- }
- }
- }]
- };
或者
- var option = {
- series: [{
- type: 'liquidFill',
- data: [0.5, 0.4, {
- value: 0.3,
- itemStyle: {
- color: 'red',
- opacity: 0.6
- },
- emphasis: {
- itemStyle: {
- opacity: 0.9
- }
- }
- }]
- }]
- };
2.3 设置静态的波形
为了防止波浪向左或向右移动动画,将waveAnimation设置为false。禁用波浪上升的动画,设置animationDuration和animationDurationUpdate为0。
- var option = {
- series: [{
- type: 'liquidFill',
- waveAnimation: false,
- animationDuration: 0,
- animationDurationUpdate: 0,
- data: [0.6, 0.5, 0.4, 0.3]
- }]
- };
2.4 设置水平的静态波形
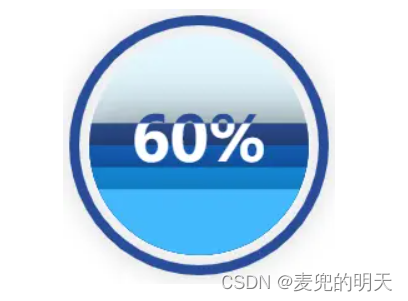
- var option = {
- series: [{
- type: 'liquidFill',
- data: [0.6, 0.5, 0.4, 0.3],
- amplitude: 0,
- waveAnimation: 0//考虑性能,建议将该值设置false
- }]
- };
2.5 改变某个波形样式
- var option = {
- series: [{
- type: 'liquidFill',
- data: [0.6, {
- value: 0.5,
- direction: 'left',//波形向左移动
- itemStyle: {
- color: 'red'//波形颜色
- }
- }, 0.4, 0.3]
- }]
- };
direction: 设为 'left' 或 'right',指定波浪的移动方向
2.6 设置水球图背景色和内边框样式
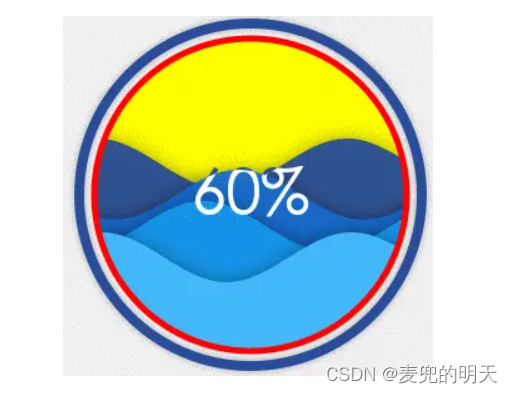
- var option = {
- series: [{
- type: 'liquidFill',
- data: [0.6, 0.5, 0.4, 0.3],
- backgroundStyle: {
- borderWidth: 5,//边框宽度
- borderColor: 'red',//边框颜色
- color: 'yellow'//背景色
- }
- }]
- };
2.7 设置外边框
- 设置outline.show为 false,隐藏外边框
- var option = {
- series: [{
- type: 'liquidFill',
- data: [0.6, 0.5, 0.4, 0.3],
- outline: {
- show: false
- }
- }]
- };
2.8 设置水球图形状
设置shape值:
1) 'circle', 'rect', 'roundRect', 'triangle', 'diamond', 'pin', 'arrow'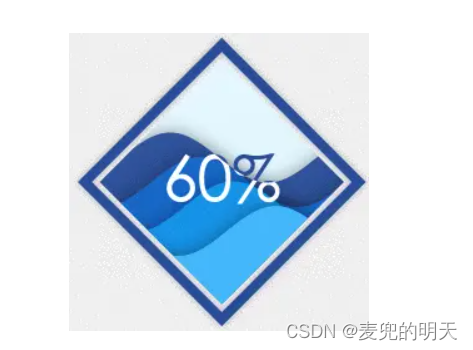
- var options = [{
- series: [{
- type: 'liquidFill',
- data: [0.6, 0.5, 0.4, 0.3],
- shape: 'diamond'
- }]
- }];
2)'container':装满容器的形状。
- option = {
- series: [{
- type: 'liquidFill',
- data: [0.5, 0.4, 0.3, 0.2],
- shape: 'container',
- outline: {
- show: false
- }
- }]
- };
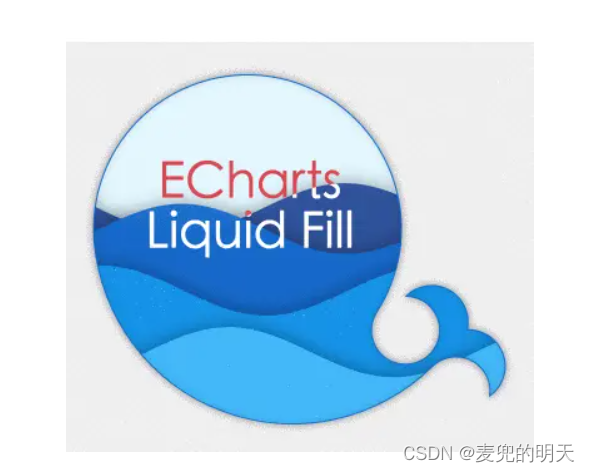
3)一个以'path://'开头的SVG路径。
- var option = {
- series: [{
- type: 'liquidFill',
- data: [0.6, 0.55, 0.4, 0.25],
- radius: '60%',
- outline: {
- show: false
- },
- backgroundStyle: {
- borderColor: '#156ACF',
- borderWidth: 1,
- shadowColor: 'rgba(0, 0, 0, 0.4)',
- shadowBlur: 20
- },
- shape: 'path://M367.855,428.202c-3.674-1.385-7.452-1.966-11.146-1.794c0.659-2.922,0.844-5.85,0.58-8.719 c-0.937-10.407-7.663-19.864-18.063-23.834c-10.697-4.043-22.298-1.168-29.902,6.403c3.015,0.026,6.074,0.594,9.035,1.728 c13.626,5.151,20.465,20.379,15.32,34.004c-1.905,5.02-5.177,9.115-9.22,12.05c-6.951,4.992-16.19,6.536-24.777,3.271 c-13.625-5.137-20.471-20.371-15.32-34.004c0.673-1.768,1.523-3.423,2.526-4.992h-0.014c0,0,0,0,0,0.014 c4.386-6.853,8.145-14.279,11.146-22.187c23.294-61.505-7.689-130.278-69.215-153.579c-61.532-23.293-130.279,7.69-153.579,69.202 c-6.371,16.785-8.679,34.097-7.426,50.901c0.026,0.554,0.079,1.121,0.132,1.688c4.973,57.107,41.767,109.148,98.945,130.793 c58.162,22.008,121.303,6.529,162.839-34.465c7.103-6.893,17.826-9.444,27.679-5.719c11.858,4.491,18.565,16.6,16.719,28.643 c4.438-3.126,8.033-7.564,10.117-13.045C389.751,449.992,382.411,433.709,367.855,428.202z',
- label: {
- position: ['38%', '40%'],
- formatter: function() {
- return 'ECharts\nLiquid Fill';
- },
- fontSize: 40,
- color: '#D94854'
- }
- }]
- };
2.9 动画
一般来说,在液体填充图中有两种类型的动画。
1)第一类是初始动画,具有起浪的效果。这个动画的easing方法由animationEasing控制,它的持续时间由animationDuration控制。
2)第二种类型是更新动画,通常在数据变化和波高变化时使用。它们由animationEasingUpdate和animationDurationUpdate控制。
例如,要禁用上升动画,并将动画更新时间设置为2秒,使用以下选项:- var option = {
- series: [{
- type: 'liquidFill',
- data: [0.6, 0.5, 0.4, 0.3],
- animationDuration: 0,
- animationDurationUpdate: 2000,
- animationEasingUpdate: 'cubicOut'
- }]
- };
- chart.setOption(option);
- setTimeout(function () {
- chart.setOption({
- series: [{
- type: 'liquidFill',
- data: [0.8, 0.6, 0.4, 0.2]
- }]
- })
- }, 3000);
2.10 改变文字
1)默认情况下,液体填充图的文本标签显示第一个数据的百分比。例如,对于数据为[0.6,0.5,0.4,0.3]的图表,默认文本为60%。
2)要更改文本,可以使用标签。格式化程序,可以设置为字符串或函数。
3)如果是字符串,{a}表示序列名,{b}表示数据名,{c}表示数据值。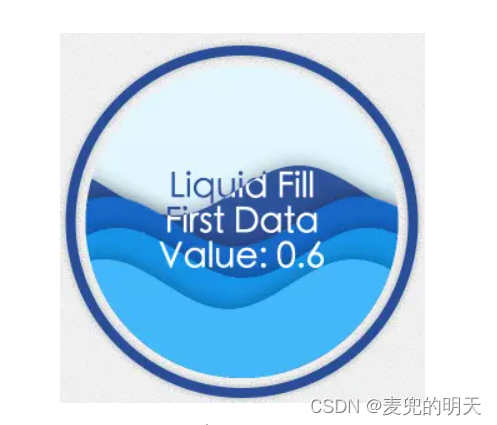
- var option = {
- series: [{
- type: 'liquidFill',
- name: 'Liquid Fill',
- data: [{
- name: 'First Data',
- value: 0.6
- }, 0.5, 0.4, 0.3],
- label: {
- formatter: '{a}\n{b}\nValue: {c}',
- fontSize: 28
- }
- }]
- };
或者
- var option = {
- series: [{
- type: 'liquidFill',
- name: 'Liquid Fill',
- data: [{
- name: 'First Data',
- value: 0.6
- }, 0.5, 0.4, 0.3],
- label: {
- formatter: function(param) {
- return param.seriesName + '\n'
- + param.name + '\n'
- + 'Value:' + param.value;
- },
- fontSize: 28
- }
- }]
- };
文本位置默认位于center。label.position可以设置为'inside', 'left', 'right', 'top', 'bottom',或水平和垂直位置,例如:['10%','20%'],这意味着左边的'10%'(由label.align控制,可以设置'left', 'center', or 'right')和“20%”顶部(由label.baseline控制,可以设置 'top', 'middle', or 'bottom')。
2.11 阴影

默认情况下,波浪和轮廓有阴影。以下是如何改变它们的方法
- var option = {
- series: [{
- type: 'liquidFill',
- data: [0.6, 0.5, 0.4, 0.3],
- itemStyle: {
- shadowBlur: 0
- },
- outline: {
- borderDistance: 0,
- itemStyle: {
- borderWidth: 5,
- borderColor: '#156ACF',
- shadowBlur: 20,
- shadowColor: 'rgba(255, 0, 0, 1)'
- }
- }
- }]
- };
2.12 提示框
添加tooltip,鼠标移入后的提示框信息显示- var option = {
- series: [{
- type: 'liquidFill',
- data: [0.6],
- name: 'Liquid Fill'
- }],
- tooltip: {
- show: true
- }
- };
2.13 点击事件
在waves上添加点击事件:
- chart.setOption(option);
- chart.on('click', function() {
- console.log(arguments);
- // do something useful here
- });
与其他图表类型一样,上述代码只会触发wave上的事件。如果你想在整个画布或特定元素上跟踪事件,你可以像这样在zrender中添加监听器:
- chart.getZr().on('click', function() {
- console.log(arguments);
- });
Non-interactable
要使一个元素(例如,一个波)非交互,只需将silent设置为true。3、API
默认项参数
- {
- data: [],
- color: ['#294D99', '#156ACF', '#1598ED', '#45BDFF'],
- center: ['50%', '50%'],
- radius: '50%',
- amplitude: '8%',
- waveLength: '80%',
- phase: 'auto',
- period: 'auto',
- direction: 'right',
- shape: 'circle',
- waveAnimation: true,
- animationEasing: 'linear',
- animationEasingUpdate: 'linear',
- animationDuration: 2000,
- animationDurationUpdate: 1000,
- outline: {
- show: true,
- borderDistance: 8,
- itemStyle: {
- color: 'none',
- borderColor: '#294D99',
- borderWidth: 8,
- shadowBlur: 20,
- shadowColor: 'rgba(0, 0, 0, 0.25)'
- }
- },
- backgroundStyle: {
- color: '#E3F7FF'
- },
- itemStyle: {
- opacity: 0.95,
- shadowBlur: 50,
- shadowColor: 'rgba(0, 0, 0, 0.4)'
- },
- label: {
- show: true,
- color: '#294D99',
- insideColor: '#fff',
- fontSize: 50,
- fontWeight: 'bold',
- align: 'center',
- baseline: 'middle'
- position: 'inside'
- },
- emphasis: {
- itemStyle: {
- opacity: 0.8
- }
- }
- }
3.1 data {(number|Object)[]}
1)data里的每一项必须为0-1之间的值
2)data的每一项也可以是Object,设置单波形样式- //设置第二波形为红色
- var option = {
- series: [{
- type: 'liquidFill',
- data: [0.6, {
- value: 0.5,
- itemStyle: {
- color: 'red'
- }
- }, 0.4, 0.3]
- }]
- };
3.2 color {string[]}
设置波形颜色
color: ['#294D99', '#156ACF', '#1598ED', '#45BDFF']3.3 shape {string}
设置水球图形状
1)'circle', 'rect', 'roundRect', 'triangle', 'diamond', 'pin', 'arrow'
2)一个以'path://'开头的SVG路径3.4 center {string[]}
水球图的位置。第一个值是x位置,第二个是y位置。每个值都可以是一个相对值,比如‘50%’,它是相对于容器宽度和高度的较小值,或者是一个绝对值,比如100px。
3.5 radius {string}
图表的半径,可以是一个相对值,如“50%”,这是相对于容器的宽度和高度的较小值,或一个绝对值,如“100px”。
3.6 amplitude {number}
水波的振幅,以像素或百分比表示。如果是百分比,那就是相对于直径。
3.7 waveLength {string|number}
水波的波长,可以是一个相对值,如“50%”,这是相对于直径,或绝对值,如“100px”或“100”。
3.8 phase {number}
弧度系统中波的相位。默认情况下,是auto即每一个波比前面一个波大`Math.PI / 4的相位。
3.9 period {number|'auto'|function}
向前移动一个波长所需的毫秒数。默认情况下,它被设置为“auto”即前面的波有更高的速度。
它也可以是一个函数格式。- var option = {
- series: [{
- type: 'liquidFill',
- data: [0.6, 0.5, 0.4, 0.3],
- radius: '70%',
- phase: 0,
- period: function (value, index) {
- // This function is called four times, each for a data item in series.
- // `value` is 0.6, 0.5, 0.4, 0.3, and `index` is 0, 1, 2, 3.
- return 2000 * index + 1000;
- }
- }]
- }
3.10 direction {string}
水波移动的方向,可以设置为'right'或者'left'
3.11 waveAnimation {boolean}
是否允许水波向左移动或向右移动。
3.12 animationEasing {string}
初始动画的缓动效果,例如当波从底部开始上升
3.13 animationEasingUpdate {string}
数据更新动画的缓动效果,例如,当数据值变化和波的位置变化时。
3.14 animationDuration {number}
初始动画的时长,单位为毫秒。
3.15 animationDurationUpdate {number}
数据更新动画的时长,单位为毫秒。
3.16 outline.show {boolean}
是否显示外边框
3.16 outline.borderDistance {number}
外边框与内圈之间的距离。
3.17 outline.itemStyle.borderColor {string}
外边框颜色
3.18 outline.itemStyle.borderWidth {number}
外边框宽度
3.19 outline.itemStyle.shadowBlur {number}
外边框阴影的模糊大小
3.20 outline.itemStyle.shadowColor {string}
外边框阴影颜色
3.21 backgroundStyle.color {string}
内圈背景色
3.22 backgroundStyle.borderWidth {string}
内圈描边边框
3.23 backgroundStyle.borderColor {string}
内圈描边边框颜色
3.24 backgroundStyle.itemStyle.shadowBlur {number}
背景色阴影的模糊大小
3.25 backgroundStyle.itemStyle.shadowColor {string}
背景色阴影的颜色
3.26 backgroundStyle.itemStyle.opacity {number}
背景色的透明度
3.27 itemStyle.opacity {number}
水波透明度
3.28 itemStyle.shadowBlur {number}
水波阴影的模糊大小
3.29 itemStyle.shadowColor {string}
水波阴影的颜色
3.30 emphasis.itemStyle.opacity {number}
当鼠标移入后,水波的透明度
3.31 label.show {boolean}
是否显示文本标签
3.32 label.color {string}
文本标签的颜色(background上的)
3.33 label.insideColor {string}
文本标签的颜色(wave上的)即文本标签在wave上的颜色
3.34 label.fontSize {number}
文本标签的字体大小
3.35 label.fontWeight {string}
文本标签的字体粗细
3.36 label.align {string}
文本标签的对齐。
'left','center'或'right'.3.37 label.baseline {string}
文本标签的垂直对齐方式,
'top','middle'或'bottom'.3.38 label.position {string|string[]}
文本标签的位置,默认是center。值可以设置为
'inside','left','right','top','bottom'或水平和垂直位置”(“10%”,“20%”)”,意思是“10%”的左边,“20%”。 -
相关阅读:
【从零学习python 】85.Python进程池的并行计算技术应用
网络基础知识点
RTL8380M管理型交换机系统软件操作指南一:端口配置
Spring boot入门有手就行_SpringBoot简介及3种项目搭建方式
【LeetCode每日一题:1742. 盒子中小球的最大数量~~~Map+遍历模式+计数】
IDEA使用问题-02 无法引入POM依赖
ctfshow web入门 SQl注入 web185--web190
从 C 到 C++ 编程 — 基础新增特性
Java开源工具库使用之虚假数据生成库datafaker
yarn 环境突然用不了
- 原文地址:https://blog.csdn.net/ll123456789_/article/details/133898722
