-
合成孔径雷达地面运动目标检测技术研究——基于概率图(Matlab代码实现)
🍒🍒🍒欢迎关注🌈🌈🌈
📝个人主页:我爱Matlab
👍点赞➕评论➕收藏 == 养成习惯(一键三连)🌻🌻🌻🍌希望大家多多支持🍓~一起加油 🤗
💬语录:将来的我一定会感谢现在奋斗的自己!
🍁🥬🕒摘要🕒🥬🍁
SAR(Synthetic Aperture Radar),即合成孔径雷达,是一种主动式的对地观测系统,可安装在飞机、卫星、宇宙飞船等飞行平台上,全天时、全天候对地实施观测、并具有一定的地表穿透能力。因此,SAR系统在灾害监测、环境监测、海洋监测、资源勘查、农作物估产、测绘和军事等方面的应用上具有独特的优势,可发挥其他遥感手段难以发挥的作用,因此越来越受到世界各国的重视。
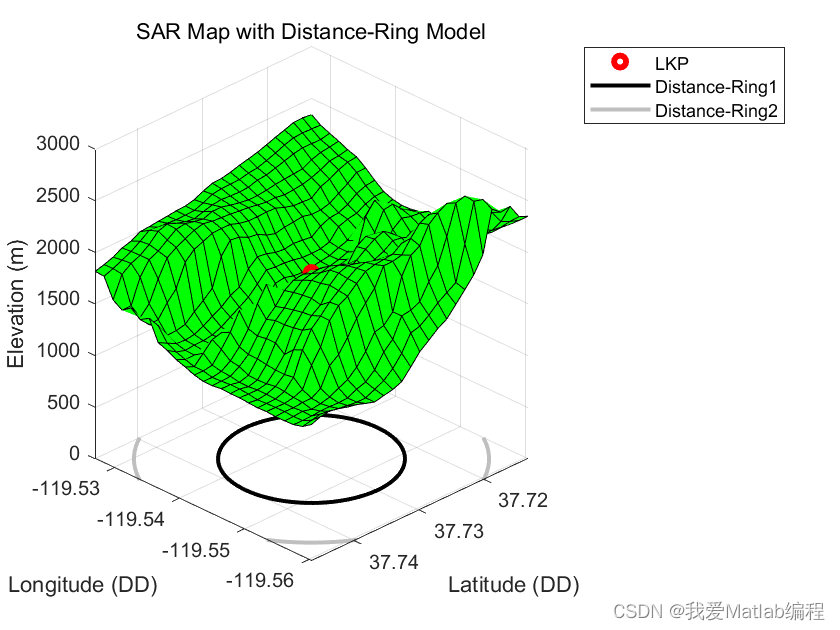
本文代码旨在搜救场景中寻找失踪人员而编写。该程序从ArcGis Pro中绘制的数字高程模型(DEM)数据中获取x、y、z输入,并在MATLAB中进行处理。该计划根据海拔、主题类别(即徒步旅行者、儿童等)和距离,生成荒野SAR中可能发现失踪人员的位置的概率图。该概率图输出格式被选择为使得可以应用旅行推销员路径规划算法,并且随后的路径被上传到无人机的CPU和自动驾驶仪,使得无人机可以自动地进行搜索模式。
✨🔎⚡运行结果⚡🔎✨


💂♨️👨🎓Matlab代码👨🎓♨️💂
%%
%Reshape the arrays iGrid.nto a grid format compataible with meshgrid
Grid.n=25;
%Grid.x = Grid.x(1:Grid.n);
%Grid.y = Grid.y(1:Grid.n:(Grid.n*Grid.n));
Grid.z=reshape(Grid.z,[Grid.n,Grid.n]);
%State data resolution gained from ArcGIS
Grid.resolution=130;%Compute meshgrid
[Grid.x,Grid.y]=meshgrid(Grid.x,Grid.y);%Surf Plot Terrain
figure
surf(Grid.x,Grid.y,Grid.z,'FaceColor', 'g');
xlabel('Longitude (DD)')
ylabel('Latitude (DD)')
zlabel('Elevation (m)')
title('Terrain Data')
xlim([min(Grid.x,[],'all'),max(Grid.x,[],'all')])
ylim([min(Grid.y,[],'all'),max(Grid.y,[],'all')])
view([225 25])
%Call the Gradient Function to Calculate Cell to Cell Gradients
[GM] = GithubGradientFunction(Grid);%%
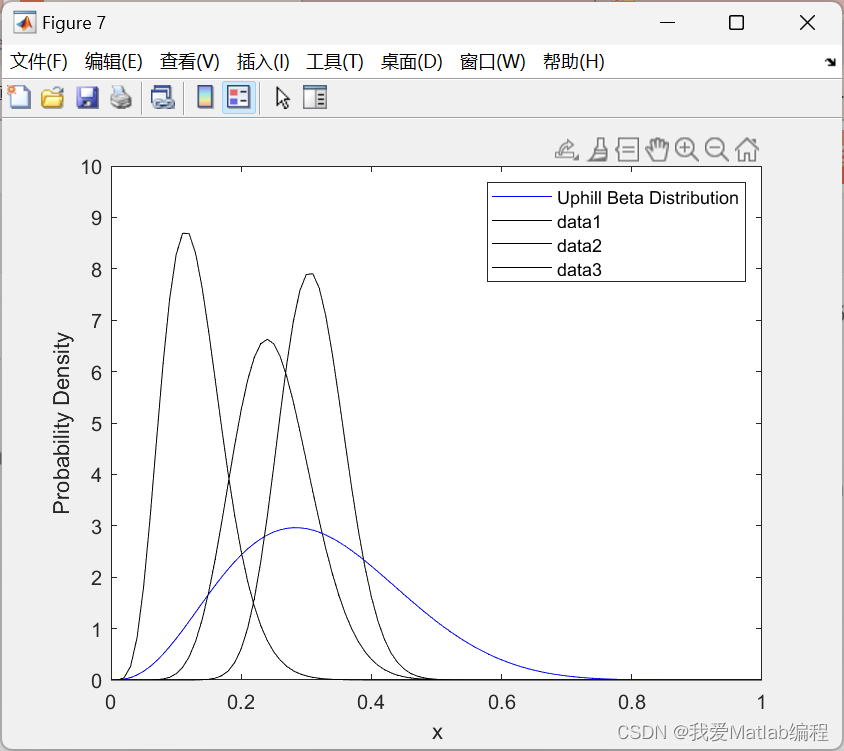
%Beta Distribution Function%Specify the number of timesteps, m
m=1;%Call Beta Distribution Function to find the probabilities.
[Prob.p_DHILLg1020,Prob.p_DHILLg2030,Prob.p_DHILLg3040,Prob.p_SAMEg0010,Prob.p_UPHILLg1020, Prob.p_UPHILLg2030,Prob.p_UPHILLg3040] = NewBetaDistribution%normalise probabilities
norm_factor = Prob.p_DHILLg1020+Prob.p_DHILLg2030+Prob.p_DHILLg3040+Prob.p_SAMEg0010+Prob.p_UPHILLg1020+Prob.p_UPHILLg2030+Prob.p_UPHILLg3040;
Prob.p_DHILLg1020 = Prob.p_DHILLg1020/norm_factor;
Prob.p_DHILLg2030 = Prob.p_DHILLg2030/norm_factor;
Prob.p_DHILLg3040 = Prob.p_DHILLg3040/norm_factor;
Prob.p_SAMEg0010 = Prob.p_SAMEg0010/norm_factor;
Prob.p_UPHILLg1020 = Prob.p_UPHILLg1020/norm_factor;
Prob.p_UPHILLg2030 = Prob.p_UPHILLg2030/norm_factor;
Prob.p_UPHILLg3040 = Prob.p_UPHILLg3040/norm_factor;%%
%Transition Matrix%Blank Probability Vector
Grid.InitialVector= zeros(1,Grid.n*Grid.n);
%State LKP Vertex
Grid.LKPvertex=313;
%State LKP Vertex Probability
Grid.InitialVector(1,Grid.LKPvertex)=1;
%Set the Counter
Count=Grid.n*Grid.n;%Preallocate Transition Matrix Memory
TransitionMatrix=zeros(Grid.n^2);📜📢🌈参考文献🌈📢📜
[1]郭兆明,姜毅,毕世华.合成孔径雷达卫星车辆运动侦察概率探究[J].导航定位学报,2019,7(03):24-30.DOI:10.16547/j.cnki.10-1096.20190305.
-
相关阅读:
OpenCV学习 基础图像操作(十七):泛洪与分水岭算法
AxureR9根据选择内容触发不同的事件
【软件测试】测试人终将迎来末路?测试人的我35岁就坐等失业?
python 数据结构与算法 < >链表
工作相关----《系统部署相关操作》
【一文秒懂——SLF4j日志】
AI少女 升级包
Docker swarm 管理 secrets
Linux下文件和目录的基础操作
博流RISC-V芯片BL616开发环境搭建
- 原文地址:https://blog.csdn.net/weixin_66436111/article/details/128111388