-
ELK日志实时分析
项目实训报告:ELK日志实时分析
任务目标
-
使用filebeat采集日志数据,通过kafka将数据传输给logstash进行过滤,最后输出到Elasticsearch绘制数据图表。
-
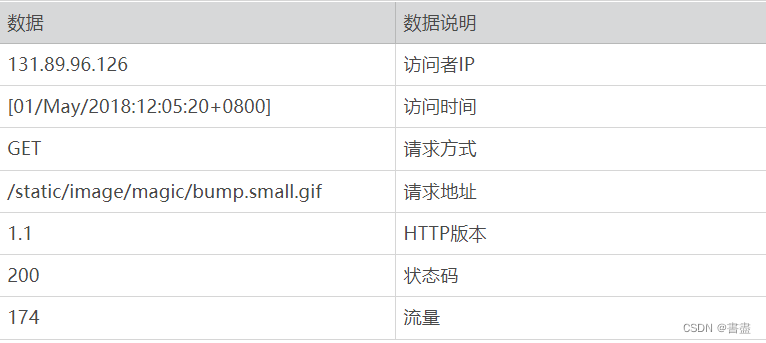
数据说明
实施步骤
- 将数据上传到家目录(/home/hadoop)(系统中已经存在,不用上传)
- 删除以前filebeat中的数据文件:
cd /usr/local/filebeat/data rm -r regsitry- 1
- 2

- 编写filebat配置文件,采集家目录下名为access_2018_05_01.log的数据文件
cd /usr/local/filebeat vim filebeat.yml # 修改以下配置 filebeat.inputs: - type: log enabled: true paths: - /home/hadoop/access_2018_05_01.log output.kafka: hosts: ["localhost:9092"] topic: "applog" processors: - drop_fields: fields: ["beat", "input", "source", "offset"]- 1
- 2
- 3
- 4
- 5
- 6
- 7
- 8
- 9
- 10
- 11
- 12
- 13
- 14
- 15

- 启动kafka进程,并启动filebeat
cd /usr/local/kafka ./bin/zookeeper-server-start.sh -daemon ./config/zookeeper.properties- 1
- 2

- 修改kafka配置文件
cd /usr/local/kafka/config/ vim server.properties # 按照如下内容修改配置文件 listeners=PLAINTEXT://localhost:9092- 1
- 2
- 3
- 4


- 启动kafka
cd /usr/local/kafka ./bin/kafka-server-start.sh -daemon ./config/server.properties jps- 1
- 2
- 3

- 启动filebeat
cd /usr/local/filebeat/ ./filebeat -e -c filebeat.yml #不要关闭此窗口,方便调试- 1
- 2
- 3

- 配置Logstash接收kafka数据,并匹配日志文件中的详细指标,使用geoip取出IP地址的地理位置信息,并将结果输出到Elasticsearch。
cd /usr/local/logstash/ vim logstash-plain-map.conf #配置文件内容如下- 1
- 2
- 3
- 4
- 5
input{ kafka{ bootstrap_servers=> "localhost:9092" topics => ["applog"] group_id => "logstash-file" codec => "json" } } filter{ grok{ match => { "message" => "%{IPORHOST:clientip} %{HTTPDUSER:ident} %{HTTPDUSER:auth} \[%{HTTPDATE:timestamp}\] \"%{WORD:verb} %{NOTSPACE:request}(?: HTTP/%{NUMBER:httpversion})\" %{NUMBER:response}\ %{NUMBER:bytes}" } } geoip { source => "clientip" database => "/home/hadoop/GeoLite2-City.mmdb" } } output{ elasticsearch { hosts => ["localhost:9200"] index => "logstash-logs-2022" } stdout{ codec => rubydebug } }- 1
- 2
- 3
- 4
- 5
- 6
- 7
- 8
- 9
- 10
- 11
- 12
- 13
- 14
- 15
- 16
- 17
- 18
- 19
- 20
- 21
- 22
- 23
- 24
- 25
- 26
- 27
- 28
- 启动Elasticsearch
cd /usr/local/elasticsearch-6.1.0/ ./bin/elasticsearch #此窗口不要关闭,方便调试- 1
- 2
- 3
- 新建一个终端窗口,运行Logstash分析软件
cd /usr/local/logstash logstash -f ./logstash-plain-map.conf- 1
- 2
- 启动Kibana,在任意终端输入
kibana- 1
- 然后访问[虚拟机IP地址]:5601, 点击Management,然后选择“Create index pattern", 在”Index pattern" 栏中输入“logstash-logs-2020",点击"Next step"
- 设置时间过滤器字段名称,选择@timestamp 点击 “Create index pattern” .


- 绘制各时间段访问流量图。点击“Visualize”,选择加号,创建“Line”图,设置X轴的“Aggregation”为“terms”,“Field”为“timestamp.keyword”,“Size”为10,


-
如果不能显示结果,请点击右上角的时间过滤器,选择this week

-
保存各时间段访问流量图。点击“Save”,将名称设置为“各时间段访问流量”

-
创建访问流量前10名图新建Vertical Bar 图,
X轴的 Aggregation设为 Terms,
filed设为geoip.country_code3.keyword
size 10- 制网站总访问流量图。创建Metric图,并保存。
- 创建访问前10名访问量占比图新建Pie图
X轴Aggregation 为TermsField:geoip.country_code3.keyword
size:10- 创建世界访问分布图新建 Coordinate Map
X轴 Aggregation:geohash
Field: geoip.location- 创建仪表盘。
点击 Dashboard, 选择 “ Create a dashboard" 点击Add 单击显示的所有图表名称。
实训小结
- 日志实时分析是 ELK 组件的核心业务场景之一,而核心中的核心是 Logstash 中间处理 filter 环节。
- 掌握了 filter 环节,就掌握了 ELK 实时日志分析的精髓。
- logstash-plain-map.conf 和 filebeat.yml 两个文件容易出错,注意缩进
- 有些窗口不可关闭!!!


-
-
相关阅读:
学3D建模要注意什么问题?入行好几年,踩过的坑后的经验
【力客热题HOT100】-【052】146 LRU缓存
Docker TimeScaleDB
基于FPGA点阵显示屏设计-毕设
基于虚拟力优化的无线传感器网络覆盖率matlab仿真
速度与敏捷:解密Velocity的奥秘
2022-08-26 Unity视频播放2——视频剪辑设置
Instagram Shop如何开通?如何销售?最全面攻略
123456
新能源商用车、物流车及末端配送车亮相2024快递物流展
- 原文地址:https://blog.csdn.net/weixin_51309151/article/details/127864688